![]()
MARKET EQUILIBRIUM, GRAPHICAL ANALYSIS: An analysis of market equilibrium using a graph that combines a demand curve and a supply curve. A graphical analysis of the market is used to ascertain information such as market equilibrium, equilibrium price, equilibrium quantity, shortage, and surplus. This is one of two basic methods of analyzing market equilibrium. The other is a numerical analysis using demand and supply schedules.A graphical analysis of the market combines the demand curve, which captures the demand side, with a corresponding supply curve, which illustrates the supply side. It is a powerful tool for the economic analysis of market exchanges. However, it also forms the foundation for analyzing all sorts of market-based phenomena, including market adjustment, price floors, price ceilings, tax incidence, minimum wages, externalities, market control, monopoly, regulations, public goods, and... a whole lot more. Setting the StageThe location of the market to be studied is the Shady Valley Exposition Center. The event is the 88th Annual Trackmania 8-Track Tape Collectors Convention. The purpose is the exchange of 8-track music tapes filled with the works of classic performers such as The Carpenters and Englebert Humperdink. The Center is filled with 8-track buyers and 8-track sellers.
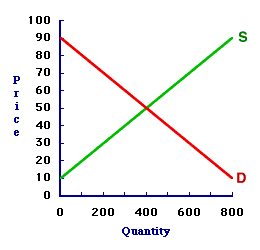
A few observations about this graph are in order:
What If?To while away the time, it might be interesting to play the economic game of "What if?" That is, what occurs if the market price is 30 cents, 50 cents, 70 cents, or some other price?
Neither price is suitable. Either the buyers are not able to buy what they want or the sellers are not able to sell what they have. This market is not in equilibrium at either price. One side or the other is left wanting, which prompts the unsatisfied side to take corrective action, action that alters the price. A changing price is a sure sign that the market is not at equilibrium. Equilibrium?If a 30 cent price is so low that it triggers a price increase and a 70 cent price is so high that it triggers a price decrease, then perhaps a price between these two would achieve an equilibrium balance.What about a 50 cent price? Click the [50 Cent] button to highlight this price. At this price, the demand curve and supply curve intersect. The quantity demanded is 400 tapes and the quantity supplied is 400 tapes. This looks promising. The buyers can buy all that they want. The sellers can sell all that they want. Neither buyers nor sellers are motivated to change the price. The forces of demand and supply appear to be in balance. As a matter of fact, the 50 cent price IS the equilibrium price. At 50 cents, the quantity demanded is equal to the quantity supplied. This is the ONLY price that achieves a balance between these two quantities. Best of all, because this is equilibrium, the equilibrium price of 50 cents does not change and the equilibrium quantity of 400 tapes does not change unless or until an external force intervenes. Check Out These Related Terms... | market equilibrium | equilibrium | market equilibrium, numerical analysis | equilibrium price | equilibrium quantity | market clearing | shortage | surplus | Or For A Little Background... | demand curve | supply curve | market | demand | supply | demand price | supply price | quantity demanded | quantity supplied | law of demand | law of supply | And For Further Study... | stable equilibrium | unstable equilibrium | market disequilibrium | self correction, market | disequilibrium price | comparative statics | market demand | market supply | exchange | competitive market | demand determinants | supply determinants | ceteris paribus | market-oriented economy | elasticity | utility analysis | short-run production analysis | Recommended Citation: MARKET EQUILIBRIUM, GRAPHICAL ANALYSIS, AmosWEB Encyclonomic WEB*pedia, http://www.AmosWEB.com, AmosWEB LLC, 2000-2025. [Accessed: December 16, 2025]. |
![]()