|
|
GRAPHICAL ANALYSIS: The process of investigating economic phenomena in a systematic manner using graphs and diagrams. Graphical analysis is a common type of economic analysis.
Visit the GLOSS*arama
|
|


|

|
                           AVERAGE-MARGINAL RELATION: A mathematical connection between a marginal value and the corresponding average value stating that the change in the average value depends on a comparison between the average and the marginal. This mathematical relation between average and marginal surfaces throughout the study of economics, especially production (average product and marginal product), cost (average total cost and marginal cost), and revenue (average revenue and marginal revenue). A similar relation is that between a total value and the corresponding marginal value. The mathematical relation between average and marginal means that the average value is "driven" by the marginal value. - If the marginal is less than the average, then the average declines.
- If the marginal is greater than the average, then the average rises.
- If the marginal is equal to the average, then the average does not change.
The reason for this relation is that average value is based on the existing situation that is then modified by the marginal value. This average-marginal relation applies to average and marginal product, average and marginal cost, average and marginal revenue, and well, any other average and marginal encountered in the study of economics.To illustrate the basic nature of the average-marginal relation consider an example. Suppose that there is a room containing five people that have been painstakingly and accurately measured for height. The average height of this group is 66 inches (5' 6"). Some are taller than 5' 6" and some are shorter, but the average is 5' 6". What happens to this 5' 6" average should a sixth person enter the room? This surely depends on the height of this extra person, this marginal addition to this group, does it not? - If this "marginal" person is 6' tall, then the group's average rises to exactly 5' 7". The marginal is greater than the average, and the average rises.
- If the marginal sixth person is, however, a mere 5' tall, the marginal is less than the average, then the average declines to 5' 5".
- And if the new, marginal person, is exactly 5' 6'', the same as the existing average, then the average does not change.
| Average and Marginal Product |  |
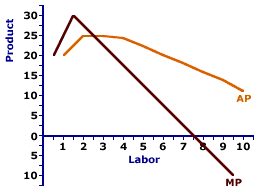
This average-marginal relation can be graphically illustrated, using the average product and marginal product curves displayed to the right. A comparison between average product and marginal product reveals three alternatives.- When the marginal measure is greater than the average measure (that is, the marginal product curve lies above the average product curve), then the average measure increases (and the average product curve has a positive slope).
- Alternatively, when the marginal measure is less than the average measure (that is, the marginal product curve lies below the average product curve), then the average measure decreases (and the average product curve has a negative slope).
- In addition, when the marginal measure is equal to the average measure (that is, the marginal product curve intersects the average product curve), then the average measure does not change (and the average product curve has a zero slope).

Recommended Citation:AVERAGE-MARGINAL RELATION, AmosWEB Encyclonomic WEB*pedia, http://www.AmosWEB.com, AmosWEB LLC, 2000-2024. [Accessed: July 26, 2024].
Check Out These Related Terms... | | | | | | | |
Or For A Little Background... | | | | | |
And For Further Study... | | | | | | | | |
Search Again?
Back to the WEB*pedia
|


|

|
RED AGGRESSERINE
[What's This?]
Today, you are likely to spend a great deal of time looking for the new strip mall out on the highway wanting to buy either a how-to book on home remodeling or a tall storage cabinet with five shelves and a secure lock. Be on the lookout for the last item on a shelf.
Your Complete Scope
This isn't me! What am I?
|

|
|
Helping spur the U.S. industrial revolution, Thomas Edison patented nearly 1300 inventions, 300 of which came out of his Menlo Park "invention factory" during a four-year period.
|

|
|
"Old age isn't so bad when you consider the alternative. " -- Cato, Roman orator
|

|
ADV PMT
Advance Payment
|

|
|
Tell us what you think about AmosWEB. Like what you see? Have suggestions for improvements? Let us know. Click the User Feedback link.
User Feedback
|


|


