|
|
OMB: The abbrevation for Office of Management and Budget, which is an office within the Executive branch (specifically within the Office of the White House), that assists the President in various fiscal matters. Established in 1970, the Office of Management and Budget (OMB) is responsible for developing the President's annual budget request to Congress, managing the Executive Branch, and evaluating Federal government regulations. The OMB staff are appointed by the President, but unlike other appointments, they do not need Senate confirmation. The duty of preparing the fiscal budget, and what this means for fiscal policy, has made the director of the OMB one of the more influential economic positions in country, ranking just a notch below the Chairman of the Federal Reserve System's Board of Governors and the Chairman of the Council of Economic Advisors. The Congressional counterpart of the OMB is the Congressional Budget Office (CBO).
Visit the GLOSS*arama
|
|


|

|
                           MONOPSONY, MINIMUM WAGE: A minimum wage is a legally established floor on the wage rate that employers can pay their workers. Monopsony is a market structure dominated on the demand side by a single buyer. Contrary to standard analysis, imposing a minimum wage on monopsony market can actually increase employment. The primary reason a minimum wage is imposed on a market is to boost the wage paid to workers. However, standard economic analysis suggests that a minimum wage disrupts an efficient, competitive market, resulting in an unemployment surplus. While employed workers are paid a higher wage, the wage paid to unemployed workers falls to zero. On balance, workers in total might be worse off with the minimum wage than without.This standard analysis, however, assumes that a minimum wage is applied to an efficient, competitive market. If a minimum wage is applied to a monopsony market, these conclusions do not necessarily hold. In particular, a minimum wage can increase employment and counter some of the inefficiency created by monopsony. Standard Analysis| Competitive Market |  |
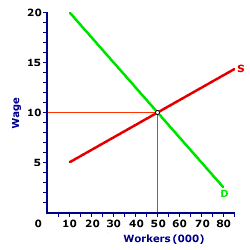
A review of the standard minimum wage analysis is the best place to begin. This exhibit presents a competitive market for lumber workers. Because the market has a large number of sellers AND BUYERS, a competitive equilibrium is found at the intersection of the demand and supply curves. The competitive wage is $10 per worker with 50,000 workers employed.What happens when a minimum wage is imposed on this efficient, competitive market? A minimum wage disrupts this competitive equilibrium and creates a surplus of unemployed workers. To see how a $12 minimum wage affects this market, click the [Minimum Wage] button. - Quantity Demanded: At this $12 minimum wage, the quantity demanded is 42,500 workers. Fewer workers are demanded because employers must match a higher marginal revenue product with the higher wage.
- Quantity Supplied: At this $12 minimum wage, the quantity supplied is 66,000 workers. More workers are willing to offer their labor services because the higher wage compensates for a higher opportunity cost.
- Surplus: As a result, the quantity supplied exceeds the quantity demanded and a surplus of 13,500 workers is created. The minimum wage creates 13,500 unemployed workers, workers who are willing and able to work at the $12 minimum wage, but who cannot find employment.
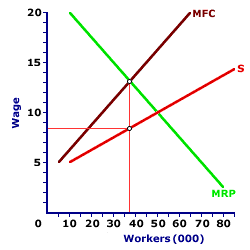
Ironically, the average wage paid to all 66,000 potential workers is about $7.73. This is a weighted average of the $12 wage paid to 42,500 workers, plus the $0 wage paid to the 13,500 unemployed workers. Because this is less than the original wage, the overall pool of workers is actually worse off, on average, with the minimum wage than withoutMonopsony EmploymentDoes this conclusion hold if the minimum wage is placed on a monopsony market? The first step in answering this question, is to review the profit maximizing decision of a monopsony, which is illustrated in the exhibit displayed here. Suppose that the market for lumber workers is taken over by a monopsony buyer, the Natural Ned Lumber Company, the only employer for lumber workers. As the only buyer, workers must work for Natural Ned or they do not work.| Monopsony |  |
- Factor Supply Curve: The key for any monopsony buyer like the Natural Ned Lumber Company is that the supply curve that it faces for hiring labor is THE market supply curve for the factor. This is the positively-sloped factor supply curve, labeled S in this diagram. It is also identical to the supply curve in the preceeding exhibit for the competitive market.
- Marginal Factor Cost Curve: A second curve in this new exhibit is the positively-sloped marginal factor cost curve, labeled MFC. This curve indicates the additional cost Natural Ned incurs from hiring an extra worker. It is positively sloped and lies above the factor supply curve.
- Marginal Factor Cost Curve: The third and remaining curve in the exhibit is the marginal revenue product curve, labeled MRP. This curve measures that value of the extra production each worker contributes to Natural Ned's revenue. For sake of comparison, this marginal revenue product curve is identical to the market demand curve in the analysis of the competitive market.
As a profit-maximizing entity, the Natural Ned Lumber Company hires labor services up to the point in which marginal factor cost is equal to marginal revenue product. This quantity of 37,000 workers is highlighted in this exhibit. The Natural Ned Lumber Company then pays each worker $8.40 per hour.Note that these are not the same wage and employment numbers for the competitive market. The reason is the monopsony hires fewer workers and pays a lower wage. This results because market control by monopsony does not generate equality between marginal revenue product and factor price. Imposing a minimum wage on this market can actually counter this inefficiency. Imposing a Minimum WageNow consider how a minimum wage affects this monopsony market. While a couple of alternatives are possible, consider how a $10 minimum wage affects this monopsony market. This $10 wage is that generated by the competitive market. To impose the $10 minimum wage on this market, click the [Monopsony Minimum Wage] button.The most important effect of this minimum wage is to alter the factor supply and marginal factor cost facing the Natural Ned Lumber Company. By imposing a minimum wage, the portion of the supply curve that carries a factor price less than $10 is no longer relevant. The factor supply curve facing the Natural Ned Lumber Company now consists of two segments. The first segment is horizontal at the $10 wage. The second segment is the original factor supply curve above the $10 wage. The change in factor supply also cause changes in the marginal factor cost. Because the Natural Ned Lumber Company can hire up to 50,000 workers at the constant $10 wage, the marginal factor cost curve coincides with this horizontal segment of the factor supply curve up to 50,000 workers. At 50,000 workers the marginal factor cost curve then turns vertical until it joins the original marginal factor cost curve. Given these new factor supply and marginal factor cost curves, what quantity of lumber workers does the Natural Ned Lumber Company employ? As a profit-maximizing employer, the Natural Ned Lumber Company hires the quantity that equates marginal factor cost and marginal revenue product. This occurs at the $10 minimum wage and 50,000 workers. This is, by no coincidence, the intersection of the marginal revenue product curve and the factor supply curve. This is, by no coincidence, the perfectly competitive, efficient, outcome. And none of this is coincidence because $10 minimum wage is designed to generate that particular outcome. How does this minimum wage outcome compare with the monopsony outcome? The wage rate is obviously greater ($10 compared to $8.40). However, employment is ALSO greater (50,000 workers compared to 37,000 workers). And there is NO unemployment? The minimum wage did not created unemployment. In fact, MORE workers are employed and they ALL receive a higher wage. It is a win-win situation for ALL workers in the market. So what can be concluded from this little analysis? - First, if a labor market is relatively competitive, then the standard minimum wage analysis is appropriate. A minimum wage creates unemployment.
- Second, if the labor market is controlled by a monopsony seller, then a minimum wage can actually improve the efficiency of the market and reduce unemployment.
However, because labor markets seldom fit the extreme characteristics of either perfect competition or monopsony, a bit of generalization might prove useful. A minimum wage is increasingly effective in improving efficiency, the more the market is controlled by buyers. A minimum wage is increasingly problematic, the more the market is competitive.

Recommended Citation:MONOPSONY, MINIMUM WAGE, AmosWEB Encyclonomic WEB*pedia, http://www.AmosWEB.com, AmosWEB LLC, 2000-2025. [Accessed: July 18, 2025].
Check Out These Related Terms... | | | | |
Or For A Little Background... | | | | | | | | |
And For Further Study... | | | | |
Search Again?
Back to the WEB*pedia
|


|

|
WHITE GULLIBON
[What's This?]
Today, you are likely to spend a great deal of time searching the newspaper want ads seeking to buy either an extra large beach blanket or a large flower pot shaped like a Greek urn. Be on the lookout for fairy dust that tastes like salt.
Your Complete Scope
This isn't me! What am I?
|

|
|
The first U.S. fire insurance company was established by Benjamin Franklin in 1752 in Philadelphia.
|

|
|
"A winner is someone who recognizes his God-given talents, works his tail off to develop them into skills, and uses those skills to accomplish his goals. " -- Larry Bird, basketball player
|

|
ACH
Automated Clearinghouse
|

|
|
Tell us what you think about AmosWEB. Like what you see? Have suggestions for improvements? Let us know. Click the User Feedback link.
User Feedback
|


|


