
|
|
VALUE IN USE: The satisfaction of wants and needs provided by the direct consumption of goods and services. Acquiring value from the use of goods and services is really the ultimate goal of economic activity. It is the final step in the production, allocation, and consumption activities that undertaken to address the fundamental problem of scarcity. Value in use should be contrasted with the similar phrase, value in exchange.
Visit the GLOSS*arama
|
|


|

|
                           TOTAL FIXED COST CURVE: A curve that graphically represents the relation between total fixed cost incurred by a firm in the short-run product of a good or service and the quantity produced. This curve is constructed to capture the relation between total fixed cost and the level of output, holding other variables, like technology and resource prices, constant. Because total fixed cost are, in fact, fixed, the total fixed cost curve is, in fact, a horizontal line. The total fixed cost curve is one of three total cost curves, the other two are total cost curve and total variable cost curve. | Total Fixed Cost Curve | 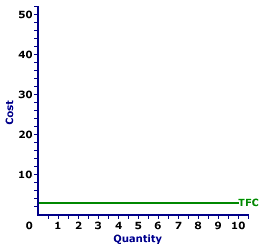 |
The total fixed cost curve is the most straightforward of the three total curves (the other two being total cost curve and total variable cost curve). The reason for such straightforwardness is that total fixed cost is fixed. It is the same at all output levels.The total fixed cost curve can be derived in two ways. One is to plot a schedule of numbers relating output quantity and total fixed cost. The other is to vertically subtract the total variable cost curve from the total cost curve. The total fixed cost curve can be used to derive average fixed cost. Total fixed cost is visually illustrated by the graph to the right, which is the total fixed cost curve for the short-run production of Wacky Willy Stuffed Amigos (those cute and cuddly armadillos and tarantulas). The quantity of Stuffed Amigos production, measured on the horizontal axis, ranges from 0 to 10 and the total fixed cost incurred in the production of Stuffed Amigos, measured on the vertical axis, is $3 at each quantity of production. Because total fixed cost is fixed, the total fixed cost curve is a horizontal line that intersects the vertical axis at $3. If production is 0 Stuffed Amigos, total fixed cost is $3. If Stuffed Amigo production is 10, total fixed cost is $3. If production of Stuffed Amigos is boosted to a billion, then total fixed cost is $3.
Recommended Citation:TOTAL FIXED COST CURVE, AmosWEB Encyclonomic WEB*pedia, http://www.AmosWEB.com, AmosWEB LLC, 2000-2025. [Accessed: July 1, 2025].
Check Out These Related Terms... | | | | | | | | | | | | | |
Or For A Little Background... | | | | | | | | | | | | |
And For Further Study... | | | | | | | | | | | |
Search Again?
Back to the WEB*pedia
|

|

|
BEIGE MUNDORTLE
[What's This?]
Today, you are likely to spend a great deal of time touring the new suburban shopping complex looking to buy either a genuine down-filled pillow or one of those "hang in there" kitty cat posters. Be on the lookout for defective microphones.
Your Complete Scope
This isn't me! What am I?
|

|
|
Mark Twain said "I wonder how much it would take to buy soap buble if there was only one in the world."
|

|
|
"Experience keeps a dear school, but fools will learn in no other. " -- Benjamin Franklin
|

|
WLLN
Weak Law of Large Numbers
|

|
|
Tell us what you think about AmosWEB. Like what you see? Have suggestions for improvements? Let us know. Click the User Feedback link.
User Feedback
|

|






