
|
|
PHYSICAL CAPITAL: The synthetic resources used to produce goods and services. Capital is a factor of production that has been previously produced. Unlike other types of material items, capital does not become a part of the product. This should be compared with financial capital and human capital.
Visit the GLOSS*arama
|
|


|

|
                           AVERAGE TOTAL COST CURVE: A curve that graphically represents the relation between average total cost incurred by a firm in the short-run product of a good or service and the quantity produced. The average total cost curve is constructed to capture the relation between average total cost and the level of output, holding other variables, like technology and resource prices, constant. The average total cost curve is one of three average curves. The other two are average variable cost curve and average fixed cost curve. A related curve is the marginal cost curve. The average total cost curve is U-shaped. Average total cost is relatively high for small quantities of output, then as production increases, it declines, reaches a minimum value, then rises.Because average total cost is a combination of average variable cost and average fixed cost, the U-shape of the average total cost curve is a result of both underlying averages. At small production quantities, both average fixed cost and average variable cost decline, resulting in a negatively-sloped average total cost curve. However, because of the law of diminishing marginal returns, average variable cost eventually increases, which overwhelms the continuing decline of average fixed cost and results in a positively-sloped average total cost curve. | Average Total Cost Curve | 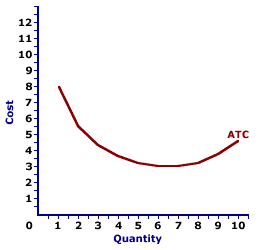 |
The graph to the right is the average total cost curve for the short-run production of Wacky Willy Stuffed Amigos (those cute and cuddly armadillos and tarantulas). The quantity of Stuffed Amigos production, measured on the horizontal axis, ranges from 0 to 10 and the average total cost incurred in the production of Stuffed Amigos, measured on the vertical axis, ranges from about $3 to over $8.As noted above, the average total cost curve is U-shaped. For the first 6 Stuffed Amigos, average total cost declines from over $8 to a low of $3. However, for the production beyond 7 Stuffed Amigos, average total cost increases. While it would be easy to attribute the U-shape of the average total cost curve to increasing, then decreasing marginal returns (and the law of diminishing marginal returns), such is not completely true. While the law of diminishing marginal returns is indirectly responsible for the positively-sloped portion of the average total cost curve, the negatively-sloped portion is attributable to increasing marginal returns, and perhaps more importantly to declining average fixed cost. The average total cost curve is most important to the analysis of a firm's short-run production when compared to the price. If price is greater than average total cost, then a firm receives economic profit on each unit of the output produced and sold. If price is less than average total cost, then a firm incurs a loss on each unit produced and sold. However, whether or not the loss is great enough to force the firm to shut down production depends on a comparison between price and average variable cost.
Recommended Citation:AVERAGE TOTAL COST CURVE, AmosWEB Encyclonomic WEB*pedia, http://www.AmosWEB.com, AmosWEB LLC, 2000-2025. [Accessed: July 18, 2025].
Check Out These Related Terms... | | | | | | | | | | | | |
Or For A Little Background... | | | | | | | | | | | |
And For Further Study... | | | | | | | | | | | | | | | | | |
Search Again?
Back to the WEB*pedia
|

|

|
BLUE PLACIDOLA
[What's This?]
Today, you are likely to spend a great deal of time searching the newspaper want ads looking to buy either a wall poster commemorating the first day of winter or blue cotton balls. Be on the lookout for rusty deck screws.
Your Complete Scope
This isn't me! What am I?
|

|
|
Approximately three-fourths of the U.S. paper currency in circular contains traces of cocaine.
|

|
|
"A winner is someone who recognizes his God-given talents, works his tail off to develop them into skills, and uses those skills to accomplish his goals. " -- Larry Bird, basketball player
|

|
APT
Arbitrage Pricing Theory
|

|
|
Tell us what you think about AmosWEB. Like what you see? Have suggestions for improvements? Let us know. Click the User Feedback link.
User Feedback
|

|






