|
|
PIE CHART: A circular graph divided into wedges that is commonly used to present the division of a total among parts. The circular "pie" represents the total value and each slice represents the portion distributed to each category. Pie charts are a handy way to present information, but are not well suited for more involved economic analysis.
Visit the GLOSS*arama
|
|


|

|
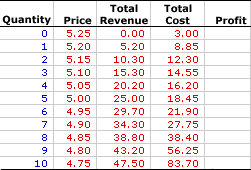
                           MONOPOLISTIC COMPETITION, PROFIT ANALYSIS: A monopolistically competitive produces the profit-maximizing quantity of output that generates the highest level of profit. This profit approach is one of three methods that used to determine the profit-maximizing quantity of output. The other two methods involve a comparison of total revenue and total cost and a comparison of marginal revenue and marginal cost. Monopolistic competition is a market structure with a large number of relatively small firms that sell similar but not identical products. Each firm is small relative to the overall size of the market such that it has some market control, but not much. In other words, it can sell a wide range of output at a narrow range of prices. This translates into a relatively elastic demand curve. If a monopolistically competitive firm wants to sell a larger quantity, then it must lower the price.Comparable to any profit-maximizing firm, a monopolistically competitive firm produces the quantity of output in the short run that maximizes economic profit--the difference between total revenue with total cost. At this production level, the firm cannot increase profit by changing the level of production. The analysis of economic profit can be achieved through a table of numbers or with a profit curve. Working the NumbersA monopolistically competitive firm is presumed to produce the quantity of output that maximizes economic profit--the difference between total revenue and total cost. This decision can be analyzed using this table presented below. This table presents revenue and cost information for Manny Mustard's House of Sandwich, a hypothetical example of a monopolistically competitive firm, that results from the production and sale of Deluxe Club Sandwiches, a tasty luncheon consumed by residents of Shady Valley.Because Manny produces a product with a large number of close but slightly different substitutes, he has some market control but not much. As such, he faces a negatively-sloped demand curve, but one that is relatively elastic. To sell a larger quantity, he must lower the price. Manny Mustard's status as a monopolistically competitive firm is reflected in this table. | The Sandwich Numbers |  |
- Quantity: The quantity of output produced by Manny Mustard, presented in the first column, ranges from 0 to 10 sandwiches. While, Manny Mustard could produce more than 10 sandwiches, this range is sufficient for the present analysis.
- Price: The second column presents the price received by Manny Mustard for selling sandwiches. As a price maker, the first and second columns represent the demand facing Manny for his sandwiches. The price Manny faces ranges from a high of $5.25 per sandwich for a zero quantity to a low of $4.75 per sandwich for 10 sandwiches. Manny Mustard can sell a larger quantity of sandwiches, but only by reducing the price. Manny Mustard is a price maker.
- Total Revenue: Total revenue is presented in the third column. This indicates the revenue Manny Mustard receives at each level of sandwich production. It is derived as the quantity in the first column multiplied by the price in the second column. Total revenue ranges from $0 if no output is sold to a high of $47.50 for selling 10 sandwiches. For example, selling 5 sandwiches generates $25 of revenue and selling 8 sandwiches leads to $38.80 of revenue.
- Total Cost: The fourth column presents the total cost incurred by Manny in the production of his sandwiches, ranging from a low of $3 for zero output (which is fixed cost) to a high of $83.70 for 10 sandwiches. Total cost continues to rise beyond 10 sandwiches, but this information is not needed for the present analysis. Producing 1 sandwich incurs a total cost of $8.85. Producing 2 sandwiches incurs a total cost of $12.30. Total cost rises as Manny produces more.
- Profit: The fifth column at the far right of the table is available to display economic profit, the difference between total revenue in the third column and total cost in the fourth column. A click of the [Profit] button displays Manny's economic profit in the fifth column.
The task is to identify the quantity of sandwich production that provides the maximum profit. A consideration of the options is in order.A click of the [Incurring Losses] button indicates that producing and selling 1 sandwich generates an economic loss of $3.65. Total revenue is $5.20 and total cost is $8.85. A $2 loss results from 2 sandwiches. In fact, Manny incurs an economic loss for the first 2 sandwiches. Manny also incurs an economic loss if production is 9 sandwiches or more. But loss is not what Manny Mustard seeks. Click the [Earning Profits] button to highlight the range of production levels that generate positive economic profit. Manny initially turns his profit picture around with 3 sandwiches. At 3 sandwiches Manny's total revenue is greater than his total cost by $0.75. Profit remains positive through the production of 8 sandwiches as Manny's total revenue exceeds his total cost. For 5 sandwiches, this profit is $6.55, for 6 profit is $7.80, and for 7 profit drops back to $6.55 again. So what is the profit-maximizing level of sandwich production Manny should undertake? The desired production level is clearly not 2 sandwiches or less, nor is it 9 sandwiches or more, all of which lead to economic loss. It must be within the highlighted range from 3 to 8 sandwiches. The quantity that generates the greatest of economic profit is 6 sandwiches. This alternative can be highlighted by clicking the [Profit Max] button. The production of 6 sandwiches results in $29.70 of total revenue and $21.90 of total cost, a difference of $7.80. No other production level generates a greater economic profit. Producing 1 more sandwich or 1 less sandwich reduces profit to $6.55. Working the Curves| The Sandwich Curves |  |
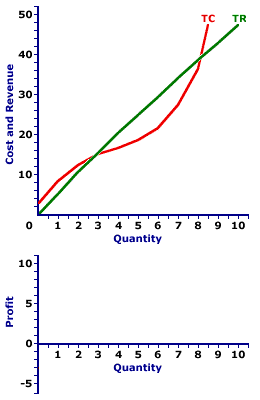
The short-run production decision for a monopolistically competitive firm can be graphically illustrated by deriving a profit curve from total revenue and total cost curves. The lower panel of the exhibit to the right is standing poised to display the profit curve for sandwich production.- Total Revenue: The slightly curved green line labeled TR depicts the total revenue that Manny Mustard receives from sandwich production. The line is slightly curved because Manny faces a relatively elastic negatively-sloped demand curve.
- Total Cost: The extra curvy red line labeled TC represents the total cost that Manny incurs in the production of sandwiches. The shape is based on increasing, then decreasing marginal returns.
- Profit: The vertical difference between these two lines is economic profit. Where the total revenue line lies above the total cost line in the middle of the diagram, economic profit is positive. Where the total revenue line lies below the total cost line at the far right and far left, economic profit is negative. The profit curve can be displayed in the lower panel by clicking the button labeled [Profit Curve].
Three segments of this profit curve are worth noting.- First, profit is negative (that is, Manny incurs an economic loss) for small quantities of output where the profit curve lies below the horizontal axis. Manny does not want to produce in this range.
- Second, profit is positive for larger quantities of output where the profit curve rises above the horizontal axis. Manny wants to produce in this range.
- Third, profit then becomes negative once again for the largest quantities of output where the profit curve dips below the horizontal axis again.
The key for Manny is to identify the production level that attains the peak of the profit curve. This is probably evident by looking at the exhibit, but it can be highlighted by clicking the [Profit Max] button. The output quantity identified is, once again, 6 sandwiches.Before leaving this graph, two other quantities can be highlighted. The profit curve intersects the horizontal axis (meaning profit is zero) at two quantities--at just under 3 sandwiches and just over 8 sandwiches. Click the [Breakeven] button to highlight these two output levels. Both quantities are termed breakeven output. Breakeven output is a quantity of output in which the total revenue is equal to total cost such that a firm earns exactly a normal profit, and thus receives no economic profit nor incurs an economic loss. The reason for the term "breakeven" output is that the firm is just "breaking even." It is neither making a profit nor incurring a loss. Economic profit is zero. Breakeven output is usually most noteworthy as a reference point. The profit-maximizing production level invariably occurs between the two breakeven output levels.

Recommended Citation:MONOPOLISTIC COMPETITION, PROFIT ANALYSIS, AmosWEB Encyclonomic WEB*pedia, http://www.AmosWEB.com, AmosWEB LLC, 2000-2025. [Accessed: July 5, 2025].
Check Out These Related Terms... | | | | | | | | |
Or For A Little Background... | | | | | | | | | |
And For Further Study... | | | | | |
Search Again?
Back to the WEB*pedia
|


|

|
|
Sixty percent of big-firm executives said the cover letter is as important or more important than the resume itself when you're looking for a new job
|

|
|
"Plans are only good intentions unless they immediately degenerate into hard work." -- Peter Drucker, management consultant
|

|
NASDAQ
National Assocation of Securities Dealers Automated Quote System
|

|
|
Tell us what you think about AmosWEB. Like what you see? Have suggestions for improvements? Let us know. Click the User Feedback link.
User Feedback
|


|


