|
|
HIGH-POWERED MONEY: Also termed the monetary base, the total of currency held by the nonbank public, vault cash held by banks, and Federal Reserve deposits of the banks. This contains the monetary components over which the Federal Reserve System has relatively complete control and is often used as a guide for the Fed's money control ability and monetary policy.
Visit the GLOSS*arama
|
|


|

|
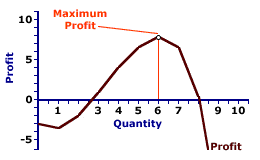
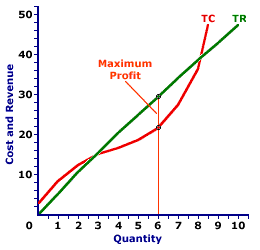
                           MONOPOLISTIC COMPETITION, PROFIT MAXIMIZATION: A monopolistically competitive is presumed to produce the quantity of output that maximizes economic profit--the difference between total revenue and total cost. This production decision can be analyzed directly with economic profit, by identifying the greatest difference between total revenue and total cost, or by the equality between marginal revenue and marginal cost. Profit Maximization
Profit Curve |  | Total Curves |  | Marginal Curves |  |
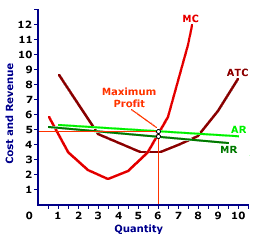
The profit-maximizing level of output is a production level that achieves the greatest level of economic profit given existing market conditions and production cost. For a monopolistically competitive firm, this entails adjusting the price and corresponding production level to achieved the desired match between total revenue and total cost.Three ViewsProfit-maximizing output can be identified in one of three ways--directly with economic profit, with a comparison of total revenue and total cost, and with comparison of marginal revenue and marginal cost.This exhibit illustrates how it can be identified for a monopolistically competitive firm, such as that operated by Manny Mustard's House of Sandwich, a well-known monopolistically competitive supplier of Deluxe Club Sandwiches, a tasty luncheon treat enjoyed by many hungry Shady Valley residents. Manny is one of many firms that produce sandwiches and similar products, meaning he faces a relatively elastic negatively-sloped demand curve. The top panel presents the profit curve. The middle panel presents total revenue and total cost curves. The bottom panel presents marginal revenue and marginal cost curves. In all three panels, Manny maximizes profit when producing 6 sandwiches. - Profit: First, profit maximization can be illustrated with a direct evaluation of profit. If the profit curve is at its peak, then profit is maximized. In the top panel, the profit curve achieves its highest level at 6 sandwiches. At other output levels, profit is less.
- Total Revenue and Total Cost: Second, profit maximization can be identified by a comparison of total revenue and total cost. The quantity of output that achieves the greatest difference of total revenue over total cost is profit maximization. In the middle panel, the vertical gap between the total revenue and total cost curves is the greatest at 6 sandwiches. For smaller or larger output levels, the gap is either less or the total cost curve lies above the total revenue curve.
- Marginal Revenue and Marginal Cost: Third, profit maximization can be identified by a comparison of marginal revenue and marginal cost. If marginal revenue is equal to marginal cost, then profit cannot be increased by changing the level of production. Increasing production adds more to cost than revenue, meaning profit declines. Decreasing production subtracts more from revenue than from cost, meaning profit also declines. In the bottom panel, the marginal revenue and marginal cost curves intersect at 6 sandwiches. At larger or smaller output levels, marginal cost exceeds marginal revenue or marginal revenue exceeds marginal cost.
More on the Marginal ViewFurther analysis of the marginal approach to analyzing profit maximization provides further insight into the short-run production decision of a monopoly.First, consider the logic behind using marginals to identify profit maximization. - Marginal revenue indicates how much total revenue changes by producing one more or one less unit of output.
- Marginal cost indicates how much total cost changes by producing one more or one less unit of output.
- Profit increases if marginal revenue is greater than marginal cost and profit decreases if marginal revenue is less than marginal cost.
- Profit neither increases nor decreases if marginal revenue is equal to marginal cost.
- As such, the production level that equates marginal revenue and marginal cost is profit maximization.
Profit Maximization,
The Marginal View |  |
With this in mind, now consider this exhibit to the right, which will eventually contain the marginal revenue and marginal cost curves for Manny Mustard's sandwich production.- Average Revenue: First up is the average revenue curve, which can be seen with a click of the [Average Revenue] button. Because Manny Mustard is a monopolistically competitive firm, this average revenue curve is also its negatively-sloped demand curve.
- Marginal Revenue: A click of the [Marginal Revenue] button reveals the green line labeled MR that depicts the marginal revenue Manny receives from sandwich production. Because Manny is a price maker, this marginal revenue curve is also a negatively-sloped line, and it lies beneath the average revenue (and demand) curve. However, because Manny's demand relatively elastic, these two curves are close together.
- Marginal Cost: A click of the [Marginal Cost] button reveals a red U-shaped curve labeled MC that represents the marginal cost Manny incurs in the production of sandwiches. The shape is based on increasing, then decreasing marginal returns.
- Profit Maximization: Profit is maximized at the quantity of output found at the intersection of the marginal revenue and marginal cost curves, which is 6 sandwiches. Click the [Profit Max] button to highlight this production level. This is the same profit-maximizing level identified using the total revenue and total cost curves and the profit curve.
Consider what results if marginal revenue is not equal to marginal cost:- If marginal revenue is greater than marginal cost, as is the case for small quantities of output, then the firm can increase profit by increasing production. Extra production adds more to revenue than to cost, so profit increases.
- If marginal revenue is less than marginal cost, as is the case for large quantities of output, then the firm can increase profit by decreasing production. Reducing production reduces revenue less than it reduces cost, so profit increases.
- If marginal revenue is equal to marginal cost, then the firm cannot increase profit by producing more or less output. Profit is maximized.
Once the profit maximizing output is revealed, the last step is to identify the price charged by Manny. This is easily accomplished by clicking the [Price] button. Price is found by extending the 6-sandwich quantity upward to the average revenue curve, which is the demand curve. Buyers are willing to pay $4.95 per sandwich if 6 sandwiches are sold.Note that this $4.95 price is greater than the $4.65 marginal cost, which indicates that monopolistic competition does not technically achieve the price-equals-marginal-cost condition for efficiency. However, because the demand curve is relatively elastic, the difference is small.

Recommended Citation:MONOPOLISTIC COMPETITION, PROFIT MAXIMIZATION, AmosWEB Encyclonomic WEB*pedia, http://www.AmosWEB.com, AmosWEB LLC, 2000-2025. [Accessed: July 18, 2025].
Check Out These Related Terms... | | | | | |
Or For A Little Background... | | | | | | | | | | | | | | |
And For Further Study... | | | | | | | |
Search Again?
Back to the WEB*pedia
|


|

|
GRAY SKITTERY
[What's This?]
Today, you are likely to spend a great deal of time driving to a factory outlet wanting to buy either a coffee cup commemorating yesterday or a replacement remote control for your television. Be on the lookout for a thesaurus filled with typos.
Your Complete Scope
This isn't me! What am I?
|

|
|
The first paper currency used in North America was pasteboard playing cards "temporarily" authorized as money by the colonial governor of French Canada, awaiting "real money" from France.
|

|
|
"A winner is someone who recognizes his God-given talents, works his tail off to develop them into skills, and uses those skills to accomplish his goals. " -- Larry Bird, basketball player
|

|
AFBD
Association of Futures Brokers and Dealers (UK)
|

|
|
Tell us what you think about AmosWEB. Like what you see? Have suggestions for improvements? Let us know. Click the User Feedback link.
User Feedback
|


|


