
|
|
MARGINAL COST AND DIMINISHING MARGINAL RETURNS: Decreasing then increasing marginal cost that gives rise to a U-shaped marginal cost curve reflects increasing then decreasing marginal returns. In particular the decreasing marginal returns is caused by the law of diminishing marginal returns. As such, the law of diminishing marginal returns affects not only the short-run production of a firm but also the cost of production in the short run.
Visit the GLOSS*arama
|
|


|

|
                           RISK AVERSION: A preference for risk in which a person prefers guaranteed or certain income over risky income. Risk aversion arises due to decreasing marginal utility of income. A risk averse person prefers to avoid risk and is willing to pay to do so, often through the purchase of insurance. This is one of three risk preferences. The other two are risk neutrality and risk loving. Risk aversion is one of three alternative preferences for risk based on the marginal utility of income. A risk averse person has decreasing marginal utility of income. With decreasing marginal utility of income a risk averse person obtains more utility from certain income than an equal amount of income involving risk. With risk, the utility from winning is exceeded by the utility from losing. Even though the expected income is equal to the certain income, the utility obtained from the certain income exceeds the utility obtained from the expected income. A risk averse person is better off avoiding risk.Because a risk averse person obtains more utility from certain income than from risky income, it follows that a smaller amount of certain income generates the same utility as the risky income. This means that a risk averse person is actually willing to pay to avoid risk. This difference in income is termed the risk premium and is the maximum price that a risk averse person would pay for an insurance policy that eliminates the risk. Two other risk preferences are risk loving and risk neutrality. A risk loving person has increasing marginal utility of income and prefers risky income to certain income. A risk neutral person has constant marginal utility of income and prefers risky income and certain income equally. Marginal Utility of Income| Marginal Utility of Income | 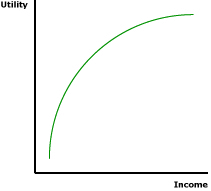 |
The best place to begin a study of risk aversion is the marginal utility of income. As a general concept, marginal utility is the change in utility resulting from a change in the quantity of a specific good consumed. Marginal utility of income is then the change in utility resulting from a change in income.The standard view in consumer demand theory is that the marginal utility of income decreases with an increase in the quantity consumed. This gives justification for the negatively-sloped demand curve. This view also generally applies to the marginal utility of income. An increase in income results in a decrease in marginal utility. Decreasing marginal utility of income results in risk aversion. However, the marginal utility of income can also increase, leading to risk loving. Or the marginal utility of income can remain constant, leading to risk neutrality. The exhibit to the right presents decreasing marginal utility of income. At low levels of income, the curve is relatively steep, then grows flatter at higher income levels. A curve of this shape is commonly termed concave. It indicates that the change in marginal utility begins relatively high, then decreases as income increases. Decreasing marginal utility of income, represented by a concave curve, is the key to risk aversion. Increasing and constant marginal utility of income, represented by a convex curve and a straight line, give rise to risk loving and risk neutrality, respectively. Risk or Certainty?Risk aversion is revealed by different preferences for income obtained with certainty and an equal amount of income that involves risk. Consider these two related concepts:- Certain Income: This is income obtained with absolutely certainty. There is no risk involved. In this analysis of risk aversion, certain income can be thought of as the amount of income that a person has without engaging in a risky situation or wager. There is no chance of receiving any more income or any less income.
- Risky Income: This is income based on the results of a risky situation, such as a wager. The risky situation might result in more income or less income. The amount of risky income is specified as the expected value, a balance between the probability of the lost income and the probability of gained income.
Suppose, for example, that a hypothetical person such as Pollyanna Pumpernickel has $100 of income and is confronted with a $50 wager on the flip of a coin. If the coin comes up heads, then she wins $50 and thus has a total of $150. If the coin comes up tails, then she loses $50 and thus has a total of only $50.The $100 that Pollyanna has at the start, and would keep if she did not wager, is the certain income. If she wants to keep this $100, then she can walk away from the wager. The risky income is the amount of income that she can expect to have after the wager. It's not $50 or $150, but the average of the two, $100, weighted by the probability of winning or losing. In other words, the expected income of a 50-50 wager is the amount of income she would expect to end up with after undertaking the wager a number of times, say a 100 or more. If she undertakes this wager 100 times, she can expect to win $50 exactly half of the time and lose $50 exactly half of the time. The loses exactly balance the wins and the income she can expect to end up with is $100. This can be summarized with the following equation. Expected
Income | = | [(p) x income with loss] | + | [(1-p) x income with win] |
Expected
Income | = | [(0.5) x $50] | + | [(0.5) x $150] |
Expected income is the income generated by a loss, weighted by the probability of losing (p), plus the income generated by a win, weighted by the probability of win (1-p). The expression in the first set of brackets is the income from losing [(0.5) x $50]. The expression in the second set of brackets is the income from winning [(0.5) x $150]. The sum of the two expressions is the income expected from the wager, the average income obtained resulting after many wagers.The Utility of IncomeWhile income is obviously important, risk aversion is based on the utility generated by the income. This is where decreasing marginal utility of income plays a key role. Two related utility concepts are worth noting. One is the utility of expected (or certain) income and the other is expected utility.- Utility of Expected Income: This is simply the amount of utility generated by income. It is identified by a utility curve such as presented in the above exhibit. It is the utility generated by certain income. Or it is the utility associated with expected income. In the previous coin-flip example facing Pollyanna Pumpernickel, the utility of certain income is equal to the utility of income expected.
- Expected Utility: This is the average utility expected from a risky situation. Like expected income, it is the utility obtained with a loss, weighted by the probability of losing, plus the utility obtained with a win, weighted by the probability of win.
The utility of expected income is identified by first identifying the value of expected or average income resulting from the wager, then identifying the utility associated with this value.In contrast, expected utility is identified by separately calculating the income from a loss, and the corresponding and the income from a win, then determining the utility from each. These utility values are then averaged, weighted by the probability of a loss and a win. Expected
Utility | = | [(p) x utility from income with loss] | + | [(1-p) x utility from income with gain] |
Working Through a Graph| Risk Aversion |
|
Risk aversion is best illustrated using a marginal utility of income curve, such as the one presented in the exhibit to the right. Income is measured on the horizontal axis and utility is measured on the vertical axis. The concave curve presented reflects decreasing marginal utility of income. The slope of the curve is steep then flattens.Let's re-evaluate the $50 flip-of-a-coin wager facing Pollyanna Pumpernickel. - First: Take note of $100 of certain income that Pollyanna has before the wager. Click the [Certain Income] button to identify this amount. Also note the amount of utility generated by this $100 of certain income, measured as U(100) on the vertical axis.
- Second: Now consider the wager, with a 50-50 chance of Pollyanna winning or losing $50. Click the [Risky Income] button to identify the possible results. If Pollyanna loses, she ends up with $50. If she wins, she ends up with $150. Also note that the expected income for this wager is $100, which like certain income generates U(100) utility, as well.
- Third: Next up is calculating expected utility from the wager. This is accomplished by identifying the utility generated by each separate outcome of the wager. Click the [Expected Utility] button for this information. The utility generated by the income resulting from the loss is measured as U(50) and the utility generated by the income resulting from the win is measured as U(150). Expected utility is then the weighted average of these two values, weighted by the probabilities of winning and losing. It is the seen as the utility associated with the intersection of the $100 of income and a straight line connecting the two utility/income wager possibilities and is measured as EU(100).
An important implication is that utility generated by the certain income, U(100), is greater than the expected utility of the wager EU(100). This indicates that Pollyanna is risk averse. She prefers certain income over risky income.However, another important implication can also be had, the risk premium. This is the amount that Pollyanna would be willing to pay to avoid the risk. It can be identified by noting the amount of income that would generate the same utility as the expected utility of the wager. A click of the [Risk Premium] button reveals this information. Note that $82 of income generates the same utility, U(82), as the expected utility from the wager EU(100). The difference between these two income levels $100 and $82, is the risk premium. That is, Pollyanna is willing to pay up to $25 to avoid the wager, to avoid the risk. This is the price she would be willing to pay for an insurance policy that eliminates this risk. Other Risk PreferencesRisk aversion is one of three risk preferences. The other two are risk loving and risk neutrality.- Risk Loving: Risk loving occurs when a person prefers risky income over certain income and arises due to increasing marginal utility of income. A person with increasing marginal utility of income obtains more utility from the income won than the income lost. The utility from winning exceeds the utility from losing. Even though the expected income is equal to the certain income, the utility obtained from the certain income falls short of the utility obtained from the expected income. A risk loving person is better off by wagering.
- Risk Neutrality: Risk neutrality occurs when a person prefers risky income equally to certain income and arises due to constant marginal utility of income. A person with constant marginal utility of income obtains the same utility from the income won as the income lost. The utility from winning equals the utility from losing. Not only is the expected income equal to the certain income, the utility obtained from the certain income equals the utility obtained from the expected income. A risk neutral person is indifferent about wagering.
Recommended Citation:RISK AVERSION, AmosWEB Encyclonomic WEB*pedia, http://www.AmosWEB.com, AmosWEB LLC, 2000-2025. [Accessed: July 18, 2025].
Check Out These Related Terms... | | | | | | | | | |
Or For A Little Background... | | | | | | | | | | |
And For Further Study... | | | | | | | | | | | | | | | | | | |
Search Again?
Back to the WEB*pedia
|

|

|
GRAY SKITTERY
[What's This?]
Today, you are likely to spend a great deal of time driving to a factory outlet wanting to buy either a coffee cup commemorating yesterday or a replacement remote control for your television. Be on the lookout for a thesaurus filled with typos.
Your Complete Scope
This isn't me! What am I?
|

|
|
There were no banks in colonial America before the U.S. Revolutionary War. Anyone seeking a loan did so from another individual.
|

|
|
"A winner is someone who recognizes his God-given talents, works his tail off to develop them into skills, and uses those skills to accomplish his goals. " -- Larry Bird, basketball player
|

|
TVC
Total Variable Cost
|

|
|
Tell us what you think about AmosWEB. Like what you see? Have suggestions for improvements? Let us know. Click the User Feedback link.
User Feedback
|

|

