
|
|
AD: The abbreviation for aggregate demand, which is the total (or aggregate) real expenditures on final goods and services produced in the domestic economy that buyers would willing and able to make at different price levels, during a given time period (usually a year). Aggregate demand (AD) is one half of the aggregate market analysis; the other half is aggregate supply. Aggregate demand, relates the economy's price level, measured by the GDP price deflator, and aggregate expenditures on domestic production, measured by real gross domestic product. The aggregate expenditures are consumption, investment, government purchases, and net exports made by the four macroeconomic sectors (household, business, government, and foreign).
Visit the GLOSS*arama
|
|


|

|
                           RISK LOVING: A preference for risk in which a person prefers risky income over guaranteed or certain income. Risk loving arises due to increasing marginal utility of income. A risk loving person prefers to undertake risk and is even willing to pay to do so. This is one of three risk preferences. The other two are risk neutrality and risk aversion. Risk loving is one of three alternative preferences for risk based on the marginal utility of income. A risk loving person has increasing marginal utility of income. With increasing marginal utility of income a risk loving person obtains more utility from income involving risk than an equal amount of certain or guaranteed income. With risk, the utility from winning exceeds the utility from losing. Even though the expected income is equal to the certain income, the utility obtained from the expected income exceeds the utility obtained from the certain income. A risk loving person is better seeking out risk.Because a risk loving person obtains more utility from risky income than from certain income, it follows that a larger amount of certain income generates the same utility as the risky income. This means that a risk loving person is actually willing to pay to undertake risk. This difference in income is termed the risk premium and is the maximum price that a risk loving person would pay for the opportunity to engage in risk. Two other risk preferences are risk aversion and risk neutrality. A risk averse person has decreasing marginal utility of income and prefers certain income to risky income. A risk neutral person has constant marginal utility of income and prefers risky income and certain income equally. Marginal Utility of Income| Marginal Utility of Income | 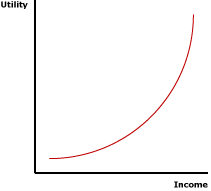 |
The best place to begin a study of risk loving is the marginal utility of income. As a general concept, marginal utility is the change in utility resulting from a change in the quantity of a specific good consumed. Marginal utility of income is then the change in utility resulting from a change in income.The standard view in consumer demand theory is that the marginal utility of income decreases with an increase in the quantity consumed. This gives justification for the negatively-sloped demand curve. This view also generally applies to the marginal utility of income. An increase in income results in a decrease in marginal utility. However, the analysis of risk preferences indicates the possibility of increasing marginal utility of income. In this case an increase in income results in a increase in marginal utility. Increasing marginal utility of income results in risk loving. However, the marginal utility of income can also remain constant, leading to risk neutrality. The exhibit to the right presents increasing marginal utility of income. At low levels of income, the curve is relatively flat, then grows steeper at higher income levels. A curve of this shape is commonly termed convex. It indicates that the change in marginal utility begins relatively low, then increases as income increases. Increasing marginal utility of income, represented by a convex curve, is the key to risk loving. Decreasing and constant marginal utility of income, represented by a concave curve and a straight line, give rise to risk aversion and risk neutrality, respectively. Risk or Certainty?Risk loving is revealed by different preferences for income obtained with certainty and an equal amount of income that involves risk. Consider these two related concepts:- Certain Income: This is income obtained with absolutely certainty. There is no risk involved. In this analysis of risk loving, certain income can be thought of as the amount of income that a person has without engaging in a risky situation or wager. There is no chance of receiving any more income or any less income.
- Risky Income: This is income based on the results of a risky situation, such as a wager. The risky situation might result in more income or less income. The amount of risky income is specified as the expected value, a balance between the probability of the lost income and the probability of gained income.
Suppose, for example, that a hypothetical person such as Winston Smythe Kennsington III has $100 of income and is confronted with a $50 wager on the flip of a coin. If the coin comes up heads, then he wins $50 and thus has a total of $150. If the coin comes up tails, then he loses $50 and thus has a total of only $50.The $100 that Winston has at the start, and would keep if he did not wager, is the certain income. If he wants to keep this $100, then he can walk away from the wager. The risky income is the amount of income that he can expect to have after the wager. It's not $50 or $150, but the average of the two, $100, weighted by the probability of winning or losing. In other words, the expected income of a 50-50 wager is the amount of income he would expect to end up with after undertaking the wager a number of times, say a 100 or more. If he undertakes this wager 100 times, he can expect to win $50 exactly half of the time and lose $50 exactly half of the time. The loses exactly balance the wins and the income he can expect to end up with is $100. This can be summarized with the following equation. Expected
Income | = | [(p) x income with loss] | + | [(1-p) x income with win] |
Expected
Income | = | [(0.5) x $50] | + | [(0.5) x $150] |
Expected income is the income generated by a loss, weighted by the probability of losing (p), plus the income generated by a win, weighted by the probability of win (1-p). The expression in the first set of brackets is the income from losing [(0.5) x $50]. The expression in the second set of brackets is the income from winning [(0.5) x $150]. The sum of the two expressions is the income expected from the wager, the average income obtained resulting after many wagers.The Utility of IncomeWhile income is obviously important, risk loving is based on the utility generated by the income. This is where increasing marginal utility of income plays a key role. Two related utility concepts are worth noting. One is the utility of expected (or certain) income and the other is expected utility.- Utility of Expected Income: This is simply the amount of utility generated by income. It is identified by a utility curve such as presented in the above exhibit. It is the utility generated by certain income. Or it is the utility associated with expected income. In the previous coin-flip example facing Winston Smythe Kennsington III, the utility of certain income is equal to the utility of income expected.
- Expected Utility: This is the average utility expected from a risky situation. Like expected income, it is the utility obtained with a loss, weighted by the probability of losing, plus the utility obtained with a win, weighted by the probability of win.
The utility of expected income is identified by first identifying the value of expected or average income resulting from the wager, then identifying the utility associated with this value.In contrast, expected utility is identified by separately calculating the income from a loss, and the corresponding and the income from a win, then determining the utility from each. These utility values are then averaged, weighted by the probability of a loss and a win. Expected
Utility | = | [(p) x utility from income with loss] | + | [(1-p) x utility from income with gain] |
Working Through a Graph| Risk Loving |
|
Risk loving is best illustrated using a marginal utility of income curve, such as the one presented in the exhibit to the right. Income is measured on the horizontal axis and utility is measured on the vertical axis. The convex curve presented reflects increasing marginal utility of income. The slope of the curve is flat then steepens.Let's re-evaluate the $50 flip-of-a-coin wager facing Winston Smythe Kennsington III. - First: Take note of $100 of certain income that Winston has before the wager. Click the [Certain Income] button to identify this amount. Also note the amount of utility generated by this $100 of certain income, measured as U(100) on the vertical axis.
- Second: Now consider the wager, with a 50-50 chance of Winston winning or losing $50. Click the [Risky Income] button to identify the possible results. If Winston loses, he ends up with $50. If he wins, he ends up with $150. Also note that the expected income for this wager is $100, which like certain income generates U(100) utility, as well.
- Third: Next up is calculating expected utility from the wager. This is accomplished by identifying the utility generated by each separate outcome of the wager. Click the [Expected Utility] button for this information. The utility generated by the income resulting from the loss is measured as U(50) and the utility generated by the income resulting from the win is measured as U(150). Expected utility is then the weighted average of these two values, weighted by the probabilities of winning and losing. It is the seen as the utility associated with the intersection of the $100 of income and a straight line connecting the two utility/income wager possibilities and is measured as EU(100).
An important implication is that utility generated by the certain income, U(100), is less than the expected utility of the wager EU(100). This indicates that Winston is risk loving. He prefers risky income over certain income.However, another important implication can also be had, the risk premium. This is the amount that Winston would be willing to pay to engage in risk. It can be identified by noting the amount of income that would generate the same utility as the expected utility of the wager. A click of the [Risk Premium] button reveals this information. Note that $118 of income generates the same utility, U(118), as the expected utility from the wager EU(100). The difference between these two income levels $100 and $118, is the risk premium. That is, Winston is willing to pay up to $25 for the opportunity to undertake wager, to engage in risk. Other Risk PreferencesRisk loving is one of three risk preferences. The other two are risk aversion and risk neutrality.- Risk Aversion: Risk aversion occurs when a person prefers certain income over risky income and arises due to decreasing marginal utility of income. A person with decreasing marginal utility of income obtains less utility from the income won than the income lost. The utility from winning is exceeded by the utility from losing. Even though the expected income is equal to the certain income, the utility obtained from the certain income is greater than of the utility obtained from the expected income. A risk aversion person is better off not wagering.
- Risk Neutrality: Risk neutrality occurs when a person prefers risky income equally to certain income and arises due to constant marginal utility of income. A person with constant marginal utility of income obtains the same utility from the income won as the income lost. The utility from winning equals the utility from losing. Not only is the expected income equal to the certain income, the utility obtained from the certain income equals the utility obtained from the expected income. A risk neutral person is indifferent about wagering.
Recommended Citation:RISK LOVING, AmosWEB Encyclonomic WEB*pedia, http://www.AmosWEB.com, AmosWEB LLC, 2000-2025. [Accessed: July 18, 2025].
Check Out These Related Terms... | | | | | | | | | |
Or For A Little Background... | | | | | | | | | | |
And For Further Study... | | | | | | | | | | | | | | | | | | |
Search Again?
Back to the WEB*pedia
|

|

|
PINK FADFLY
[What's This?]
Today, you are likely to spend a great deal of time calling an endless list of 800 numbers wanting to buy either a weathervane with a cow on top or a box of multi-colored, plastic paper clips. Be on the lookout for high interest rates.
Your Complete Scope
This isn't me! What am I?
|

|
|
More money is spent on gardening than on any other hobby.
|

|
|
"A winner is someone who recognizes his God-given talents, works his tail off to develop them into skills, and uses those skills to accomplish his goals. " -- Larry Bird, basketball player
|

|
BLUE
Best Linear Unbiased Estimator
|

|
|
Tell us what you think about AmosWEB. Like what you see? Have suggestions for improvements? Let us know. Click the User Feedback link.
User Feedback
|

|

