|
|
RESOURCE: The labor, capital, land, and entrepreneurship used by society to produce consumer satisfying goods and services. Land provides the basic raw materials--vegetation, animals, minerals, fossil fuels--that are inputs into the production of goods (natural resources). Labor is the resource that does the "hands on" work of transforming raw materials into goods. Capital is the comprehensive term for the vast array of tools, equipment, buildings, and vehicles used in production. Entrepreneurship is the resource that undertakes the risk of bringing the other resources together and initiating the production process.
Visit the GLOSS*arama
|
|


|

|
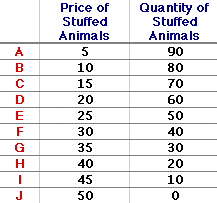
                           DEMAND CURVE: A graphical representation of the relation between the demand price and quantity demanded, holding all ceteris paribus demand determinants constant. A demand curve graphically illustrates the law of demand, the inverse relation between demand price and quantity demanded for a particular good. It is one half of the standard market model; a supply curve is the other half. A demand curve is a useful graph that can summarize several of the more important aspects of demand. It graphically illustrates the law of demand and when combined with the supply curve forms the market model, one of the most useful tools found in economic analysis.Plotting the NumbersA demand curve is commonly derived from a simple demand schedule, such as the one for stuffed Yellow Tarantulas, a cute and cuddly stuffed creature from the Wacky Willy Stuffed Amigos line of collectibles, shown in the left half of the exhibit below. This schedule illustrates the law of demand relation between demand price and quantity demanded. As the demand price increases from $5 to $50, the quantity demanded decreases from 90 to 0 Yellow Tarantulas.
| Demand Schedule | Demand Curve |  |  | |
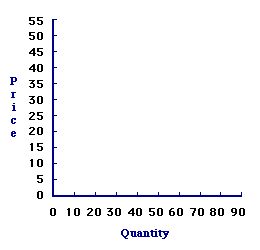
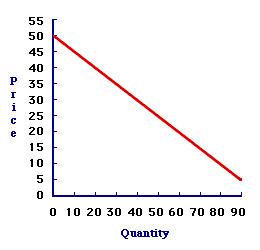
Transferring the price-quantity pairs from the demand schedule to a graph reveals the demand curve for stuffed Yellow Tarantulas. This task is easily accomplished by clicking the [Plot] button. A $5 price is associated with 90 stuffed animals; a $10 price goes with 80 stuffed animals; and on it proceeds, until finally a $50 price is paired with 0 stuffed animals.The demand curve is finalized by connecting these 10 points with a continuous line. The 10 prices corresponding to these 10 points, are but 10 of an infinite number of prices, each with a corresponding quantity. A continuous line includes these other possibilities. To reveal this line, click the [Draw] button. The end result is the demand curve. What It All MeansA Demand Curve
Yellow Tarantulas |  |
Here are a few observations about this demand curve. - First, as the price increases from a low of $5 to a high of $50, the quantity demanded of Yellow Tarantulas decreases from 90 to 0. Higher prices are related to smaller quantities. This relation, this inverse relation between demand price and quantity demanded, IS the basic law of demand.
- Second, the demand curve represents maximum values. That is, if the price is $40, then the maximum quantity demanded is 20 Yellow Tarantulas. It is not 50, nor even 21, but only 20. Alternatively, if buyers buy 20 Yellow Tarantulas, then the maximum demand price they are willing and able to pay is $40, not $50, not even $40.01, but $40.
- Third, this whole curve, every price-quantity combination on the curve, is demand. Demand is the entire range of prices and quantities, all pairs. Demand is the entire curve. In contrast, quantity demanded is any specific number of Yellow Tarantulas buyers are willing and able to buy at a specific demand price. Selecting a different price generates a different quantity demanded. Quantity demanded is a point on the curve.
- Fourth, this demand curve represents hypothetical possibilities. It suggests a "What if" relation between demand price and quantity demanded. It indicates quantity demanded given a demand price, or demand price given the quantity demanded. If, for example, the demand price is $10, then buyers are willing and able to buy 100 Yellow Tarantulas. This does not mean that buyers will buy, are buying, or ever will buy 100 Yellow Tarantulas. It only indicates what they would buy at a $10 price.

Recommended Citation:DEMAND CURVE, AmosWEB Encyclonomic WEB*pedia, http://www.AmosWEB.com, AmosWEB LLC, 2000-2025. [Accessed: July 15, 2025].
Check Out These Related Terms... | | | | | | | | | |
Or For A Little Background... | | | | | | | | | | | | |
And For Further Study... | | | | | | | | | | | | |
Search Again?
Back to the WEB*pedia
|


|

|
YELLOW CHIPPEROON
[What's This?]
Today, you are likely to spend a great deal of time visiting every yard sale in a 30-mile radius hoping to buy either a velvet painting of Elvis Presley or a wall poster commemorating yesterday. Be on the lookout for broken fingernail clippers.
Your Complete Scope
This isn't me! What am I?
|

|
|
The average bank teller loses about $250 every year.
|

|
|
"The time to repair the roof is when the sun is shining." -- John F. Kennedy, 35th U. S. president
|

|
ATC
Average Total Cost
|

|
|
Tell us what you think about AmosWEB. Like what you see? Have suggestions for improvements? Let us know. Click the User Feedback link.
User Feedback
|


|


