
|
|
BALANCE OF PAYMENTS: The difference between the funds received by a country and those paid by a country for all international transactions. The international transactions include the exchange of merchandise (exports and imports), which is commonly summarized as the balance of trade, plus the exchange of services, summarized as the balance of services, as well as any gifts or transfer payments that do not involve the exchange of goods and services. The balance of payments, in effect, indicates the difference between currency coming into a country and that flowing out of the country. The balance of payments is divided into two accounts -- current account (which includes payments for imports, exports, services, and transfers) and capital account (which includes payments for physical and financial assets).
Visit the GLOSS*arama
|
|


|

|
                           SAVING SCHEDULE: A table or chart that represents the relation between saving by the household sector and income. A saving schedule is commonly used for a basic, instructional presentation of aggregate saving activity by the household sector and is also used as a source of numbers for deriving the saving line. The key measures derived from the saving-income relation in the schedule are average propensity to save and marginal propensity to save. The consumption schedule is comparable, and more important, table for the relation between consumption and income. A saving schedule is table of numbers showing the relation between saving and income for the household sector. The income measure commonly used is national income or disposable income. Occasionally a measure of aggregate production, such as gross domestic product, is used instead.The purpose of a saving schedule is to summarize the saving-income relation for the household sector, which provides a means of deriving the saving line. The saving line is used as foundation of Keynesian economics injections-leakages model. The saving schedule and saving line also provide another way of looking at the consumption-income relation. Two important measures of saving that are usually presented in a saving schedule are average propensity to save (APS) and marginal propensity to save (MPS). APS is the average saving at each level of income and MPS is the change in saving resulting from a change in income. | Saving Schedule | 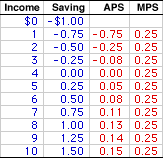 |
A representative saving schedule is presented in the exhibit to the right. The four columns in the table measure income, saving, average propensity to save (APS), and marginal propensity to save (MPS). Income and saving are measure in trillions of dollars.The first column of this table presents total income of the household sector. These values conveniently range from $0 to $10 trillion. The second column then presents the amount of this income the household sector uses for saving. These values range from -$1 trillion to $1.5 trillion. The third column is then the average propensity to save (APS), ranging from a low of -0.75 to a high of 0.15. Finally, the fourth column presents the marginal propensity to save (MPS), which remains constant at 0.25. The saving schedule summarizes important information about the saving-income relation. - One, as income increases from $0 to $10 trillion, saving increases from -$1 trillion to $1.5 trillion. This illustrates induced saving and the saving-income relation. This relation is also captured graphically in a positively-slope saving line.
- Two, income increases at a faster rate than saving. This is captured by the MPS in the fourth column and is the other side of consumption-income relation, which results from the psychological law of Keynesian economics. The MPS in the fourth column is the change in saving in the second column divided by the change in income in the first column. In this schedule, the MPS is constant at 0.25. While the MPS need not be constant over the entire range of income, it is often assumed to be for the sake of simplifying the analysis. The MPS is also the slope of the saving line.
- Three, saving is equal to $0 if income is $4 trillion. A $0 value of saving means that income and consumption are equal. In fact, while consumption, the difference between income and saving, is not explicitly shown in the table, it can be identified nonetheless. For example, at $8 trillion of income saving is $1 trillion, meaning that consumption is $7 trillion. Stating this more generally, if saving is positive, then income is greater than consumption, and if saving is negative, then income is less than consumption.
- Four, the -$1 trillion of saving undertaken when income is $0 is autonomous saving. Autonomous saving also shows up as the intercept of the saving line. The negative autonomous saving illustrated by the schedule is termed dissaving.
- Five, the APS is presented in the third column. This is simply average saving at each level of income or saving divided by income. Unlike the MPS, the APS is not constant, but differs from one income level to the next. The APS is usually negative at low income levels, then increases to positive values at higher income levels.
- Six, the amount of income and saving undertaken at full employment is not indicated by this table. In fact, full employment is largely irrelevant to this table, which is an essential point underlying Keynesian economics.
Recommended Citation:SAVING SCHEDULE, AmosWEB Encyclonomic WEB*pedia, http://www.AmosWEB.com, AmosWEB LLC, 2000-2025. [Accessed: July 18, 2025].
Check Out These Related Terms... | | | | | | | | | | | | |
Or For A Little Background... | | | | | | | | | |
And For Further Study... | | | | | | | | | | | | | | |
Search Again?
Back to the WEB*pedia
|

|

|
PINK FADFLY
[What's This?]
Today, you are likely to spend a great deal of time calling an endless list of 800 numbers wanting to buy either a weathervane with a cow on top or a box of multi-colored, plastic paper clips. Be on the lookout for high interest rates.
Your Complete Scope
This isn't me! What am I?
|

|
|
The portion of aggregate output U.S. citizens pay in taxes (30%) is less than the other six leading industrialized nations -- Britain, Canada, France, Germany, Italy, or Japan.
|

|
|
"A winner is someone who recognizes his God-given talents, works his tail off to develop them into skills, and uses those skills to accomplish his goals. " -- Larry Bird, basketball player
|

|
ISDA
International Swaps and Derivatives Association
|

|
|
Tell us what you think about AmosWEB. Like what you see? Have suggestions for improvements? Let us know. Click the User Feedback link.
User Feedback
|

|






