
|
|
MARGINAL PROPENSITY TO CONSUME: The proportion of each additional dollar of household income that is used for consumption expenditures. Or alternatively, this is the change in consumption expenditures due to a change in disposable income. Abbreviated MPC, the marginal propensity to consume is the slope of the consumption or propensity-to-consume line that forms the foundation for Keynesian economics. As such, it also takes center stage for the slope of the aggregate expenditure line and the multiplier effect. The sum of the marginal propensity to consume and the related concept, the marginal propensity to save, is equal to one.
Visit the GLOSS*arama
|
|


|

|
                           AVERAGE REVENUE CURVE: A curve that graphically represents the relation between average revenue received by a firm for selling its output and the quantity of output sold. Because average revenue is essentially the price of a good, the average revenue curve is also the demand curve for a firm's output. The average revenue curve for a firm with no market control is horizontal. The average revenue curve for a firm with market control is negatively sloped. An average revenue curve is the relation between the average revenue a firm receives from production and the quantity of output produced. The average revenue curve reflects the degree of market control held by a firm. For a perfectly competitive firm with no market control, the average revenue curve is a horizontal line. For firms with market control, especially monopoly, the average revenue curve is negatively-sloped.Perfect CompetitionPerfect competition is a market structure with a large number of small firms, each selling identical goods. Perfectly competitive firms have perfect knowledge and perfect mobility into and out of the market. These conditions mean perfectly competitive firms are price takers, they have no market control and receive the going market price for all output sold.Average Revenue Curve,
Zucchini Style | 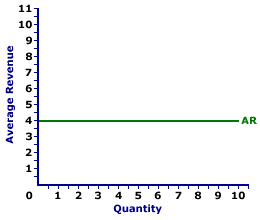 |
A representative average revenue curve for a perfectly competitive firm is displayed in the exhibit to the right. This particular average revenue curve is that for zucchini sales by Phil the zucchini grower, a presumed perfectly competitive firm. The vertical axis measures average revenue and the horizontal axis measures the quantity of output (pounds of zucchinis). Although quantity on this particular graph stops at 10 pounds of zucchinis, the nature of perfect competition indicates it could easily go higher. This curve indicates that if Phil sells 1 pound of zucchinis, then his revenue per unit is $4. However, if he sells 10 pounds, then he also receives $4 of average revenue. Should he sell 100 pounds, then he moves well beyond the graph, but his average revenue remains at $4. The average revenue curve is actually the demand curve for Phil's zucchinis. In fact, in the same way that average revenue is just another term for price, the average revenue curve is just another term for demand curve. Monopoly, Oligopoly, and Monopolistic CompetitionMonopoly is a market structure with a single firm selling a unique good. As the only firm in the market, monopoly is a price maker and has extensive market control, facing a negatively-sloped demand curve. If a monopoly wants to sell a larger quantity, then it must lower the price.Average Revenue Curve,
Medicine Style | 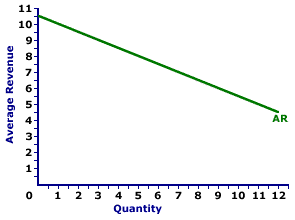 |
The average revenue curve for Feet-First Pharmaceutical is displayed in the exhibit to the right. Key to this curve is that Feet-First Pharmaceutical is a monopoly provider of Amblathan-Plus and thus faces a negatively-sloped demand curve. Larger quantities of output are only possible with lower prices.The vertical axis measures average revenue and the horizontal axis measures the quantity of output (ounces of medicine). Although quantity on this particular graph stops at 12 ounces of medicine, it could go higher. This curve indicates that if Feet-First Pharmaceutical sells 1 ounce of medicine (at $10 per ounce), then average revenue is $10 per ounce. Alternatively, if it sells 10 ounces (at $5.50 per ounce), then average revenue in is $5.50 per ounce. Should it sell 12 ounces (at $4.50 per ounce), then average revenue is $4.50 per ounce. For Feet-First Pharmaceutical the average revenue curve is also the demand curve. The curve is negatively sloped, meaning that larger quantities of output result in less average revenue. Although this average revenue curve, and preceding table of average revenue numbers, is based on the production activity of Feet-First Pharmaceutical, a well-known monopoly firm, they apply to any firm with market control. Monopolistic competition and oligopoly firms that also face negatively-sloped demand curves generate comparable average revenues.
Recommended Citation:AVERAGE REVENUE CURVE, AmosWEB Encyclonomic WEB*pedia, http://www.AmosWEB.com, AmosWEB LLC, 2000-2025. [Accessed: July 12, 2025].
Check Out These Related Terms... | | | | | | | | | | |
Or For A Little Background... | | | | | | | | | | | | | | | |
And For Further Study... | | | | | | | | | |
Related Websites (Will Open in New Window)... | | | |
Search Again?
Back to the WEB*pedia
|

|

|
WHITE GULLIBON
[What's This?]
Today, you are likely to spend a great deal of time visiting every yard sale in a 30-mile radius trying to buy either a wall poster commemorating yesterday or pink cotton balls. Be on the lookout for slightly overweight pizza delivery guys.
Your Complete Scope
This isn't me! What am I?
|

|
|
Approximately three-fourths of the U.S. paper currency in circular contains traces of cocaine.
|

|
|
"What gets measured gets done." -- Peter Drucker, educator
|

|
DIDMCA
Depository Institutions Deregulation and Monetary Control Act
|

|
|
Tell us what you think about AmosWEB. Like what you see? Have suggestions for improvements? Let us know. Click the User Feedback link.
User Feedback
|

|






