
|
|
INDEX: A measure of the relative average of a group of items compared to a given base value. Index measures are commonly used in economics to combine and compare diverse measures. One common type of index measure is for prices, such as the Consumer Price Index and the Dow Jones Industrial Average of corporate stock prices. Another noted type of index measure is to track macroeconomic activity, especially the index leading economic indicators. Indexes are usually weighted averages rather than simple arithmetic means that are measured relative to a base value or period. The Consumer Price Index, for example, measures the prices of consumer good, weighted by the quantities purchased. The value of a given period is then stated relative to a base year value, which generates a pure, "unitless" number in the range of 100 (give or take).
Visit the GLOSS*arama
|
|


|

|
                           MARGINAL REVENUE PRODUCT CURVE: A curve that graphically illustrates the relation between marginal revenue product and the quantity of the variable input, holding all other inputs fixed. This curve indicates the incremental change in total revenue for incremental changes in the variable input. The marginal revenue product curve plays a key role in marginal productivity theory and the economic analysis of factor markets. The marginal revenue product curve indicates how marginal revenue product is related to the quantity of a variable input used in production. While the analysis of factor markets tends to focus on labor as the variable input, a marginal revenue product curve can be constructed for any input.| Marginal Revenue Product Curve | 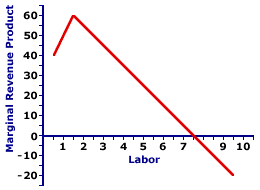 |
This diagram graphically illustrates the relation between marginal revenue product and the variable input. This particular curve is derived from the hourly production of Super Deluxe TexMex Gargantuan Tacos (with sour cream and jalapeno peppers) as Waldo's TexMex Taco World restaurant employs additional workers. The number of workers, measured on the horizontal axis, ranges from 0 to 10 and the revenue generated from the marginal production of Gargantuan Taco attributable to each extra worker, measured on the vertical axis. This variable ranges from -$20 to $60.The shape of this marginal revenue product curve is most important. For the first two workers of variable input, marginal revenue product increases, as each added worker contributes more to total revenue than previous workers. This is reflected in a positive slope of the marginal revenue product curve. From the third worker on, the marginal revenue product declines, as each added worker contributes less to total revenue than previous workers. This is seen as a negative slope. The hump-shape of the marginal revenue product curve embodies the essence of the analysis of short-run production. The upward-sloping portion of the marginal revenue product curve, up to the second worker, is due to increasing marginal returns. Decreasing marginal returns sets in after the marginal revenue product curve peaks with the second worker and declines for the third worker. In particular, this declining segment of the marginal revenue product curve reflects the law of diminishing marginal returns. This marginal revenue product curve is THE key ingredient for deriving the factor demand curve.
Recommended Citation:MARGINAL REVENUE PRODUCT CURVE, AmosWEB Encyclonomic WEB*pedia, http://www.AmosWEB.com, AmosWEB LLC, 2000-2025. [Accessed: July 18, 2025].
Check Out These Related Terms... | | | | | | | | |
Or For A Little Background... | | | | | | | | | | | | | |
And For Further Study... | | | | | | | | | |
Search Again?
Back to the WEB*pedia
|

|

|
BLACK DISMALAPOD
[What's This?]
Today, you are likely to spend a great deal of time browsing about a thrift store seeking to buy either a genuine fake plastic Tiffany lamp or a microwave over that won't burn your popcorn. Be on the lookout for small children selling products door-to-door.
Your Complete Scope
This isn't me! What am I?
|

|
|
The 22.6% decline in stock prices on October 19, 1987 was larger than the infamous 12.8% decline on October 29, 1929.
|

|
|
"A winner is someone who recognizes his God-given talents, works his tail off to develop them into skills, and uses those skills to accomplish his goals. " -- Larry Bird, basketball player
|

|
BACS
Bankers Automated Clearing Services
|

|
|
Tell us what you think about AmosWEB. Like what you see? Have suggestions for improvements? Let us know. Click the User Feedback link.
User Feedback
|

|

