
|
|
IMPLICIT PRICE DEFLATOR: A price index calculated as the ratio nominal gross domestic product to real gross domestic product. Also commonly referred to as the GDP price deflator, the implicit price deflator is used as an indicator of the economy's average price level. This price index is tabulated and reported every three months along with the gross domestic product, national income, and related measures that make up the National Income and Product Accounts maintained by the Bureau of Economic Analysis (BEA).
Visit the GLOSS*arama
|
|


|

|
                           AVERAGE FIXED COST CURVE: A curve that graphically represents the relation between average fixed cost incurred by a firm in the short-run product of a good or service and the quantity produced. This curve is constructed to capture the relation between average fixed cost and the level of output, holding other variables, like technology and resource prices, constant. The average fixed cost curve is one of three average curves. The other two are average total cost curve and average variable cost curve. A related curve is the marginal cost curve. | Average Fixed Cost Curve | 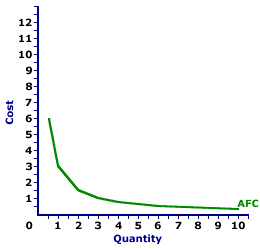 |
The average fixed cost curve is negatively sloped. Average fixed cost is relatively high at small quantities of output, then declines as production increases. The more production increases, the more average fixed cost declines. The reason behind this perpetual decline is that a given FIXED cost is spread over an increasingly larger quantity of output.The graph to the right is the average fixed cost curve for the short-run production of Wacky Willy Stuffed Amigos (those cute and cuddly armadillos and tarantulas). The quantity of Stuffed Amigos production, measured on the horizontal axis, ranges from 0 to 10 and the average fixed cost incurred in the production of Stuffed Amigos, measured on the vertical axis, ranges from a high of $6 to a low of $0.30. Actually, if the quantity is extended beyond 10 Stuffed Amigos, then average fixed cost is less than $0.30. Or if the quantity is reduced below 1/2 unit, then average fixed cost is greater than $6. For the geometrically inclined, this average fixed cost curve is a rectangular hyperbola. This declining average fixed cost curve is a major reason that the average total curve is negatively sloped for relatively small output quantities. In fact, firms that use a lot of fixed inputs relative to variable inputs, such that fixed cost is a substantial share of total cost, spend a lot of their production time in the decreasing portion of the average total cost curve. This has a big impact on how these firms operate. If average total cost declines with additional production, then a firm can profitably charge a lower price with increased output.
Recommended Citation:AVERAGE FIXED COST CURVE, AmosWEB Encyclonomic WEB*pedia, http://www.AmosWEB.com, AmosWEB LLC, 2000-2024. [Accessed: July 26, 2024].
Check Out These Related Terms... | | | | | | | | | | | | |
Or For A Little Background... | | | | | | | | | | | |
And For Further Study... | | | | | | | | | | | | | | | | | |
Search Again?
Back to the WEB*pedia
|

|

|
BROWN PRAGMATOX
[What's This?]
Today, you are likely to spend a great deal of time at the confiscated property police auction trying to buy either a birthday greeting card for your grandmother or a coffee cup commemorating yesterday. Be on the lookout for telephone calls from former employers.
Your Complete Scope
This isn't me! What am I?
|

|
|
In 1914, Ford paid workers who were age 22 or older $5 per day -- double the average wage offered by other car factories.
|

|
|
"Old age isn't so bad when you consider the alternative. " -- Cato, Roman orator
|

|
MC
Marginal Cost
|

|
|
Tell us what you think about AmosWEB. Like what you see? Have suggestions for improvements? Let us know. Click the User Feedback link.
User Feedback
|

|

