|
|
C: The standard abbreviation for consumption expenditures by the household sector, especially when used in the study of macroeconomics. This abbreviation is most often seen in the consumption function, specified as C = a + bY, where Y stands for national income. It is also used for the aggregate expenditure equation, AE = C + I + G + (X - M), where I, G, and (X - M) represent expenditures by the other three macroeconomic sectors, business, government, and foreign.
Visit the GLOSS*arama
|
|


|

|
                           AVERAGE PROPENSITY TO CONSUME: The proportion of household income that is used for consumption expenditures. The average propensity to consume (abbreviated APC) is really nothing more than average consumption. Together with the average propensity to save, it indicates how a given level of income is divided between consumption and saving. A related consumption measure is the marginal propensity to consume. The average propensity to consume (APC) indicates what the household sector does with income. The APC indicates the portion of income that is used for consumption expenditures. If, for example, the APC is 0.9, then 90 percent of income goes for consumption.The standard formula for calculating average propensity to consume (APC) is: | Consumption Schedule | 
|
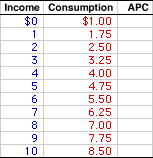
A consumption schedule, such as the one presented to the right, provides data that can be used to run through a few APC calculations. The first column in this schedule presents household income, ranging from $0 to $10 trillion. The second column presents consumption expenditures, ranging from $1 to $8.5 trillion. The task at hand is to derive the average propensity to consume at each income level.The average propensity to consume is calculated by dividing consumption in the second column by income in the first column. Beginning near the top of the schedule, if household income is $1 trillion, then consumption is $1.75 trillion, giving an average consumption of 1.75. Running the numbers through the APC formula gives: | APC | = | consumption
income | = | $1.75
$1 | = | 1.75 |
Similar calculations can be performed for each income level. For example, if income from $4, then consumption is also $4 trillion and the APC is equal 1 ($4/$4). If income is $8 trillion, the consumption is $7 trillion and the APC is equal to 0.88 ($7/$8). To display all average propensity to consume values, click the [APC] button.The prime conclusion from a quick look at the numbers is that APC declines as income increases. The APC is 1.75 for $1 trillion of income, then declines to 0.85 for $10 trillion of income. In other words, APC is not constant. The APC declines due to autonomous consumption and induced consumption. Autonomous consumption is the $1 trillion of consumption that takes place if income is zero. Induced consumption is the increase in consumption that occurs due to an increase in income. Because consumption is positive when income is zero, consumption is necessarily greater than income at low income levels, meaning the APC is greater than one. Moreover, while consumption is induced as income increases, the fundamental psychological law means that consumption increases less than income. As such, because the increment in consumption is less than the increment in income, the average declines. This is an application of the average-marginal relation. The average propensity to consume is one of four related measures. The other three are average propensity to save, marginal propensity to consume, and marginal propensity to save. - Average Propensity to Save: This is the proportion of household income that is used for saving. Abbreviated APS, this is really nothing more than average saving. Together with the average propensity to consumption, it indicates how a given level of income is divided between consumption and saving.
- Marginal Propensity to Consume: This is the change in consumption resulting from a change in income. Abbreviated MPC, this indicates the proportion of additional household income that is used for consumption. It quantifies the fundamental psychological law and is the most important of these four measures. The MPC is the slope of the consumption line, key to the slope of the aggregate expenditures line, and affects the magnitude of the multiplier.
- Marginal Propensity to Save: This is the change in saving resulting from a change in income. Abbreviated MPS, this indicates the proportion of additional household income that is used for saving. It is the flip side of the marginal propensity to consume, and thus also quantifies the fundamental psychological law. The MPS is the slope of the saving line, which enters into the injections-leakages model. The multiplier is also related to the MPS.

Recommended Citation:AVERAGE PROPENSITY TO CONSUME, AmosWEB Encyclonomic WEB*pedia, http://www.AmosWEB.com, AmosWEB LLC, 2000-2025. [Accessed: July 18, 2025].
Check Out These Related Terms... | | | | | | | |
Or For A Little Background... | | | | | | | | | | | | | |
And For Further Study... | | | | | | | | | | | | | | | | | | |
Search Again?
Back to the WEB*pedia
|


|

|
BLUE PLACIDOLA
[What's This?]
Today, you are likely to spend a great deal of time searching the newspaper want ads looking to buy either a wall poster commemorating the first day of winter or blue cotton balls. Be on the lookout for rusty deck screws.
Your Complete Scope
This isn't me! What am I?
|

|
|
A scripophilist is one who collects rare stock and bond certificates, usually from extinct companies.
|

|
|
"A winner is someone who recognizes his God-given talents, works his tail off to develop them into skills, and uses those skills to accomplish his goals. " -- Larry Bird, basketball player
|

|
PDI
Personal Disposable Income
|

|
|
Tell us what you think about AmosWEB. Like what you see? Have suggestions for improvements? Let us know. Click the User Feedback link.
User Feedback
|


|


