|
|
AGGREGATE EXPENDITURE LINE: A line representing the relation between aggregate expenditures and gross domestic product used in the Keynesian cross. The aggregate expenditure line is obtained by adding investment expenditures, government purchases, and net exports to the consumption line. As such, the slope of the aggregate expenditure line is largely based on the slope of the consumption line (which is the marginal propensity to consume), with adjustments coming from the marginal propensity to invest, the marginal propensity for government purchases, and the marginal propensity to import. The intersection of the aggregate expenditures line and the 45-degree line identifies the equilibrium level of output in the Keynesian cross.
Visit the GLOSS*arama
|
|


|

|
                           AVERAGE REVENUE AND MARGINAL REVENUE: A mathematical connection between average revenue and marginal revenue stating that the change in the average revenue depends on a comparison between average revenue and marginal revenue. For perfect competition, with no market control, marginal revenue is equal to average revenue, and average revenue does not change. For monopoly and other firms with market control, marginal revenue is less than average revenue, and average revenue falls. The relation between average revenue and marginal revenue',500,400)">marginal revenue is one of several that reflect the general relation between a marginal and the corresponding average. The general relation is this:- If the marginal is less than the average, then the average declines.
- If the marginal is greater than the average, then the average rises.
- If the marginal is equal to the average, then the average does not change.
This general relation surfaces throughout the study of economics. It also applies to average and marginal product, average and marginal cost, average and marginal factor cost, average and marginal propensity to consume, and well, any other average and marginal encountered in economics.Marginal Equals Average| Perfect Competition |  |
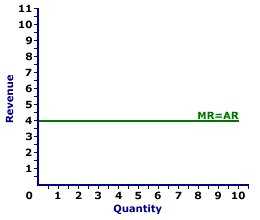
The equality between average revenue and marginal revenue occurs for a firm selling an output in a perfectly competitive market. This is illustrated by the exhibit to the right. This exhibit contains the average revenue curve and marginal revenue curve for zucchini sold by Phil the zucchini grower, a hypothetical firm in Shady Valley. Phil the zucchini grower is one of thousands of zucchini growers in the market, selling identical products. As such, Phil receives the going price for zucchini.The primary observation from this exhibit is that (apparently) only one curve is displayed. This single horizontal line, labeled MR = AR, is actually two curves, the marginal revenue curve and the average revenue curve. They appear to be one curve because each overlays the other. They coincide because marginal revenue is equal to average revenue at every output quantity. The equality between marginal revenue and average revenue is the result of perfect competition. Because Phil receives the same per unit price for every worker, incremental revenue is equal to the per unit revenue. Marginal Less Than Average| Monopoly |  |
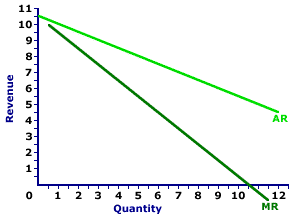
Marginal revenue falling short of average revenue occurs for a firm selling an output in a monopoly market. This is illustrated by the exhibit to the right. This exhibit contains the average revenue curve and marginal revenue curve for medicine sold another hypothetical firm, Feet-First Pharmaceutical. By virtue of a government patent, Feet-First Pharmaceutical is the only producer of Amblathan-Plus, the only cure for the deadly (but hypothetical) foot ailment known as amblathanitis. As the only producer, Feet-First is a monopoly with extensive market control, and it faces a negatively-sloped demand curve. To sell more Amblathan-Plus, Feet-First Pharmaceutical charges a lower price.The primary observation from this exhibit is that the negatively-sloped marginal revenue curve lies below the negatively-sloped average revenue curve. The juxtaposition of these two curves illustrates the marginal less than average relation. Because the marginal revenue is less than average revenue, the average revenue curve decreases. Because Feet-First Pharmaceutical has market control and faces a negatively-sloped factor demand curve it must charge a lower price to sell more Amblathan-Plus. Suppose, for example, that Feet-First Pharmaceutical wants to increase the quantity of Amblathan-Plus sold from 4 to 5 ounces. To do so, it must decrease the price from $8.50 to $8. The average revenue generated from five ounces is $8, the new price. However, the lower price is charged to all buyers. What happens to Feet-First Pharmaceutical's total revenue when it lowers the price? Two forces are at work: (1) the revenue gained by adding extra ounces and (2) the revenue lost by lowering the price for existing ounces. Marginal revenue is the net result of both. - First, by lowering its price, Feet-First Pharmaceutical increases the quantity sold from 4 ounces to 5 ounces. This extra ounce generates an extra $8 of revenue, the price of the fifth ounce. This is $8 of extra revenue that Feet-First Pharmaceutical did NOT have at the higher price. If this is all the of story, then Feet-First Pharmaceutical would have a marginal revenue of $8 for the fifth ounce, equal to the price.
- Second, by lowering its price, Feet-First Pharmaceutical collects less revenue from its other 4 ounces. It would have collected $8.50 per ounce for a total of $34 at the higher price. But with the lower $8 price it collects only $32, a reduction of total revenue by $2, or $0.50 per ounce.
The $8 gained by selling the extra ounce is partially offset by the $2 lost from lowering the price for other ounces. On net, total revenue increases by only $6. The loss of revenue collected on existing ounces is the key reason that marginal revenue is less than price.

Recommended Citation:AVERAGE REVENUE AND MARGINAL REVENUE, AmosWEB Encyclonomic WEB*pedia, http://www.AmosWEB.com, AmosWEB LLC, 2000-2025. [Accessed: July 15, 2025].
Check Out These Related Terms... | | | |
Or For A Little Background... | | | | | | | | | | |
And For Further Study... | | | | |
Search Again?
Back to the WEB*pedia
|


|

|
BEIGE MUNDORTLE
[What's This?]
Today, you are likely to spend a great deal of time browsing about a thrift store looking to buy either a solid oak entertainment center or a remote controlled ceiling fan. Be on the lookout for the happiest person in the room.
Your Complete Scope
This isn't me! What am I?
|

|
|
Potato chips were invented in 1853 by a irritated chef repeatedly seeking to appease the hard to please Cornelius Vanderbilt who demanded french fried potatoes that were thinner and crisper than normal.
|

|
|
"The time to repair the roof is when the sun is shining." -- John F. Kennedy, 35th U. S. president
|

|
MLR
Minimum Lending Rate
|

|
|
Tell us what you think about AmosWEB. Like what you see? Have suggestions for improvements? Let us know. Click the User Feedback link.
User Feedback
|


|


