|
|
ADAM SMITH: A Scottish professor (born 1723, died 1790) who is considered the father of modern economics for his revolutionary book, entitled An Inquiry into the Nature and Causes of the Wealth of Nations published in 1776.
Visit the GLOSS*arama
|
|


|

|
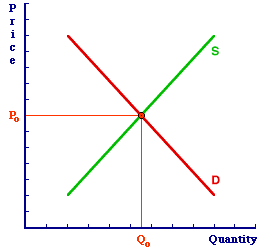
                           COMPARATIVE STATICS: The technique of comparing the equilibrium resulting from a change in a determinant, or shock to a model, with the equilibrium that existed prior to the change. Comparative statics is the primary analytical technique used in the study of economics. Comparative statics is a technique that compares one static condition with another. A popular example of this technique is found in the study of markets. Comparative statics is used to analyze how the equilibrium price and equilibrium quantity are affected by changes in the demand and supply determinants. Most other economic models, especially graphical models, make use of the comparative static technique.The Market ModelTo illustrate the use of comparative statics, consider the market model. The particular market illustrated here is for hot fudge sundaes. The original or initial equilibrium is indicate by the price Po and the quantity Qo. Comparative statics analyzes how this price and quantity change due to a disruption of the market.A change in any of the demand determinants or supply determinants can trigger such a disruption. In this case, suppose that a change in buyers' preferences causes an increase in demand, or a rightward shift of the demand curve. Specifically, suppose that buyers acquire a sudden craving for hot fudge sundaes due to a change in preferences. A newly released government study proves conclusively that daily consumption of hot fudge sundaes causes an increase in IQ by 30 points and makes people more attractive to the opposite sex. This is just the sort of thing that is bound to change buyers' preferences and increase the demand for hot fudge sundaes. And when demand increases, the previous market equilibrium is disrupted. 
|
This disruption of the market can be analyzed by systematically identifying six steps: - A determinant changes. In this analysis, buyers acquire a greater appetite for hot fudge sundaes, that is, there is a change in the buyers' preferences determinant.
- A curve shifts. The change in buyers' preferences causes the demand curve for hot fudge sundaes to shift rightward. Click the [Demand Increase] button to illustrate.
- A shortage occurs. In this analysis, the increase in demand causes a shortage of hot fudge sundaes. Click the [Shortage] button to highlight.
- The price changes. The shortage motivates buyers who are not able to get all of the hot fudge sundaes they want to increase the price of hot fudge sundaes. Click the [Price Increase] button to illustrate.
- The quantities demanded and supplied change. The rising price causes the quantity of hot fudge sundaes supplied to increase, while at the same time the higher price causes quantity of hot fudge sundaes demanded to decrease.
- A new market equilibrium is achieved. The quantity changes eliminate the shortage of hot fudge sundaes and reaches a new balance between the quantity demanded and quantity supplied. Click the [New Equilibrium] button to illustrate. The new price is Pe and the new quantity is Qe.
The comparative static analysis of this increase in buyers' preferences is an increase in the price and an increase in the quantity.No Dynamic PathWhile comparative statics is a powerful analytical tool, which is invaluable to the study of economics, care must be taken with its use. In particular, comparative static analysis only compares one static condition with another. In the analysis of the market, for example, the new equilibrium price-quantity combination is compared with the original price-quantity combination. This comparison between old equilibrium and new says nothing about the dynamic of the adjustment process.- It does not indicate how the price and quantity moved from one static equilibrium to the other. Did price fall, then rise? Did quantity decrease, then increase?
- It does not indicate how long the price and quantity took to move from one static equilibrium to the other. Did the adjustment from old to new take place in a matter of minutes, or a matter of decades.

Recommended Citation:COMPARATIVE STATICS, AmosWEB Encyclonomic WEB*pedia, http://www.AmosWEB.com, AmosWEB LLC, 2000-2025. [Accessed: July 15, 2025].
Check Out These Related Terms... | | | | | | | | |
Or For A Little Background... | | | | | |
And For Further Study... | | | | | | | | | | | | | | |
Search Again?
Back to the WEB*pedia
|


|

|
BLACK DISMALAPOD
[What's This?]
Today, you are likely to spend a great deal of time watching infomercials seeking to buy either an electric coffee pot with automatic shutoff or a brown leather attache case. Be on the lookout for crowded shopping malls.
Your Complete Scope
This isn't me! What am I?
|

|
|
North Carolina supplied all the domestic gold coined for currency by the U.S. Mint in Philadelphia until 1828.
|

|
|
"The time to repair the roof is when the sun is shining." -- John F. Kennedy, 35th U. S. president
|

|
BIS
Bank for International Settlements
|

|
|
Tell us what you think about AmosWEB. Like what you see? Have suggestions for improvements? Let us know. Click the User Feedback link.
User Feedback
|


|


