|
|
LAND: One of four basic categories of resources, or factors of production (the other three are labor, capital, and entrepreneurship). This category includes the natural resources used to produce goods and services, including the land itself; the minerals and nutrients in the ground; the water, wildlife, and vegetation on the surface; and the air above.
Visit the GLOSS*arama
|
|


|

|
                           AVERAGE FACTOR COST: Total factor cost per unit of factor input employed by a firm in the production of output, found by dividing total factor cost by the quantity of factor input. Average factor cost, abbreviated AFC, is generally equal to the factor price. However, using the longer term average factor cost makes it easier to see the connection to related terms, including total factor cost and marginal factor cost. Average factor cost is the per unit opportunity cost incurred by a firm from the employment of a given resource. It plays a key role in the study of factor markets. Average factor cost is constant (that is, it does not change if the quantity of the factor input changes) for a firm buying factors through a perfectly competitive factor market. For a monopsony buyer that controls the buying-side of the market, average factor cost increases as the quantity of factor input increases. The constant or increasing nature of average factor cost is a prime indication of the market control of a firm.Whichever market structure is involved, average factor cost is calculated as the total factor cost divided by the quantity of the factor purchased, as illustrated by this equation: | average factor cost | = | total factor cost
factor quantity |
At times, it is useful to turn this equation around and calculate total factor cost from average factor cost:| total factor cost | = | average factor cost | x | factor quantity |
If the firm is hiring the factor in a perfectly competitive factor market, then the factor price is fixed or constant and so too is average factor cost. If the firm is hiring the factor in an imperfectly competitive factor market, best illustrated by monopsony, then the factor price increases with larger factor quantities and so too does average factor cost. Perfect CompetitionPerfect competition is a market structure with a large number of small participants (buyers and sellers). The good exchanged in the market is identical, regardless of who sells or who buys. Participants have perfect knowledge and perfect mobility into and out of the market. These conditions mean perfectly competitive buyers are price takers, they have no market control and must pay the going market price for all inputs bought.Average Factor Cost,
Perfect Competition |  |
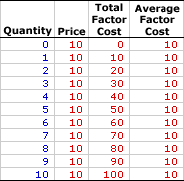
The table to the right summarizes the average factor cost incurred by a hypothetical buyer, Maggie's Macrame Shoppe, for hiring store clerks in a perfectly competitive labor market. Maggie's Macrame Shoppe is one of thousands of small retail stores in the greater Shady Valley metropolitan area that hires labor with identical skills. As such, Maggie pays the going wage for labor.The first column in the table is the quantity of workers hired, ranging from 0 to 10 workers. The second column is the price Maggie pays for hiring her workers, which is constant at $10 per worker. The third column is the total factor cost that Maggie incurs for hiring various numbers of workers. If Maggie hires only one worker, then she pays only $10. If she hires five workers, she pays $50. In each case, total factor cost in column three is calculated as the quantity in the first column multiplied by the price in the second column. The fourth column then presents the average factor cost incurred by Maggie at each level of employment. These numbers are found by dividing total factor cost in the third column by factor quantity in the first column. For example, the total factor cost of hiring five workers is $50, resulting in an average factor cost of $10 per worker. The two key observations about average factor cost are: - First, average factor cost is constant. Each level of employment results in the same $10 average factor cost.
- Second, average factor cost is equal to price at every level of employment. Average factor cost and price are essentially two terms for the same concept.
Average Factor Cost Curve,
Perfect Competition |  |
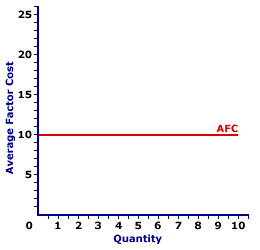
Average factor cost is commonly represented by an average factor cost curve, such as the one displayed in the exhibit to the right. This particular average factor cost curve is that for labor hired by Maggie's Macrame Shoppe. The vertical axis measures average factor cost and the horizontal axis measures the quantity of input (workers). Although quantity on this particular graph stops at 10 workers, the nature of perfect competition indicates it could easily go higher. First and foremost, the average factor cost curve is horizontal at the going factor price of $10. This indicates that if Maggie hires 1 worker, then she pays an average factor cost of $10. Alternatively, if she hires 10 workers, then she pays an average factor cost of $10. Should she hire 100 workers, then she might move well beyond the graph, but she pays an average factor cost of $10. This "curve" is actually a "straight line" because Maggie is a price taker in the labor market. She pays $10 for each worker whether she hires 1 worker or 10 workers or 100 workers. The constant price is what makes Maggie's average factor cost curve a straight line, and which indicates that Maggie has no market control. Monopsony, Oligopsony, and Monopsonistic CompetitionFor market structures like monopsony, oligopsony, and monopsonistic competition that have some degree of market control on the buying-side of the market and are price makers rather than price takers, average factor cost is little different. Market control means these market structures face positively-sloped supply curves. As such, the price received is not fixed, but depends on the quantity of the good bought.Average Factor Cost,
Monopsony |  |
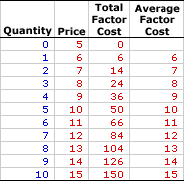
The table to the right summarizes the average factor cost received by another hypothetical firm, OmniKing Island Resort. This firm is the only employer of labor on a small tropical island. As the only employer on the island, OmniKing is a monopsony with extensive market control, and it faces a positively-sloped supply curve. To employ more workers, OmniKing must pay a higher price.This table is comparable to that for perfect competition. The first column in the table is the quantity of workers hired, ranging from 0 to 10 workers. The second column is the price OmniKing pays for hiring workers, which increases from a low of $5 for 0 workers to a high of $15 for 10 workers. The third column is the total factor cost OmniKing incurs for hiring various numbers of workers. If OmniKing hires only one worker, then it pays only $6. If it hires five workers, it pays $50. In each case, total factor cost in column three is calculated as the quantity in the first column multiplied by the price in the second column. The fourth column then presents the average factor cost incurred by OmniKing at each level of employment. These numbers are found by dividing total factor cost in the third column by factor quantity in the first column. For example, the total factor cost of hiring five workers is $50, resulting in an average factor cost of $10 per worker. The two key observations about average factor cost are: - First, average factor cost is not constant, but increases as the level of employment increases.
- Second, average factor cost is equal to price at every level of employment. Once again, average factor cost and price are basically two terms for the same concept.
Average Factor Cost Curve,
Monopsony |  |
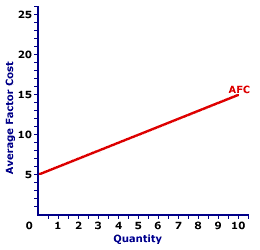
The average factor cost curve for firms with market control looks a little different than that for perfect competition. The average factor cost curve for OmniKing Island Resort is displayed in the exhibit to the right. Key to this curve is that OmniKing is a monopsony buyer of workers and thus faces a positively-sloped supply curve. Larger quantities of input can be had only with higher prices.The vertical axis measures average factor cost and the horizontal axis measures the quantity of input (workers). Although quantity on this particular graph stops at 10 workers, it could go higher. This curve indicates that if OmniKing hires 1 worker (at $6 per worker), then it incurs $6 of average factor cost. Alternatively, if it hires 10 workers (at $15 per worker), then it pays $15 of average factor cost. This positively-sloped average factor cost curve is actually nothing more than the supply curve facing OmniKing for hiring labor. In the analysis of factor markets, the average factor cost curve and the supply curve facing the firm are almost always one and the same. Although this average factor cost curve, and preceding table of average factor cost numbers, is based on the employment activity of OmniKing Island Resort, a well-known monopsony firm, they apply to any buyer with market control. Monopsonistic competition and oligopsony firms that also face positively-sloped supply curves generate comparable average factor costs.

Recommended Citation:AVERAGE FACTOR COST, AmosWEB Encyclonomic WEB*pedia, http://www.AmosWEB.com, AmosWEB LLC, 2000-2025. [Accessed: July 18, 2025].
Check Out These Related Terms... | | | | | | | | | | |
Or For A Little Background... | | | | | | | | | | | |
And For Further Study... | | | | | | | | |
Search Again?
Back to the WEB*pedia
|


|

|
PINK FADFLY
[What's This?]
Today, you are likely to spend a great deal of time calling an endless list of 800 numbers wanting to buy either a weathervane with a cow on top or a box of multi-colored, plastic paper clips. Be on the lookout for high interest rates.
Your Complete Scope
This isn't me! What am I?
|

|
|
The 1909 Lincoln penny was the first U.S. coin with the likeness of a U.S. President.
|

|
|
"A winner is someone who recognizes his God-given talents, works his tail off to develop them into skills, and uses those skills to accomplish his goals. " -- Larry Bird, basketball player
|

|
PBOT
Phildelphia Board of Trade
|

|
|
Tell us what you think about AmosWEB. Like what you see? Have suggestions for improvements? Let us know. Click the User Feedback link.
User Feedback
|


|


