|
|
KITCHIN CYCLE: A cycle of economic activity lasting between 3 and 5 years that acquired the name of the first economist to study it, Joseph Kitchin. The Kitchin cycle is attributed to investment in inventories (especially for consumer goods). It is the one that is commonly at work when people are concerned with business-cycle contractions. This is also one of four separate cycles of macroeconomic activity that have been documented or hypothesized. The other three are Juglar cycle, Kuznets cycle, and Kondratieff cycle.
Visit the GLOSS*arama
|
|


|

|
                           TOTAL FACTOR COST, MONOPSONY: The opportunity cost incurred by a monopsony when using a given factor of production to produce a good or service. This is the total cost associated with the use of a particular resource or factor of production--it is the total cost of the factor. For monopsony, the price paid increases with the quantity purchased and total factor cost increases at an increasing rate. Total factor cost is predominately used in the analysis of the factor market. Two derivative factor cost measures are average factor cost and marginal factor cost. Total factor cost is the total opportunity cost incurred by a monopsony from the employment of a given resource. This measure of cost needs to be contrasted with a similar, better known term, total cost. Total cost is the cost of all factors of production, whereas total factor cost is the cost of using a specific factor. Total cost, as such, is the sum of the total factor cost of labor, the total factor cost of capital, and the total factor cost of all other inputs. Total factor cost can be represented in a table or as a curve. For a firm with no market control hiring inputs under perfect competition, the total factor cost curve is a straight line that emerges from the origin. For firms with market control, including monopsony, oligopsony, or monopsonistic competition, the total factor cost curve increases at an increasing rate. The shape of the total factor cost curve thus indicates the degree of market control possessed by the factor buyer. Whichever market structure is involved, total factor cost is calculated as the factor price times the quantity of the factor purchased, as illustrated by this equation: | total factor cost | = | factor price | x | factor quantity |
If the firm is hiring the factor in a perfectly competitive factor market, then the factor price is fixed or constant and total factor cost increases at a constant rate. If the firm is hiring the factor in an imperfectly competitive factor market, best illustrated by monopsony, then the factor price increases with larger factor quantities and the total factor cost increases at an increasing rate. For a market structure like monopsony that has some degree of market control and is a price maker rather than a price taker, total factor cost increases at an increasing rate. Although total factor cost is also calculated as price times quantity, market control means monopsony faces a positively-sloped supply curve. As such, the price received is not fixed, but depends on the quantity of the input bought. Total Factor Cost,
Monopsony |  |
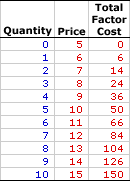
The table to the right summarizes the total factor cost received by a hypothetical firm, OmniKing Island Resort. This firm is the only employer of labor on a small tropical island. As the only employer of labor on the Island, OmniKing is a monopsony with extensive market control, and it faces a positively-sloped supply curve. To employ more workers, OmniKing must pay a higher price.Consider a few tidbits of information about total factor cost for a firm with market control, such as OmniKing Island Resort. - First, total factor cost is zero if OmniKing hires no labor. This makes sense. If nothing is bought, no factor cost is incurred.
- Second, the price changes with the quantity of output bought. OmniKing can hire 1 worker for $6. However, if it choses to hire 5 workers, then it must raise the price to $10.
- Third, as OmniKing hires more labor it pays more total factor cost.
- Fourth and last, the extra factor cost incurred from hiring more labor is not constant nor is it equal to the price. For example, the fifth worker adds a extra $14 to factor cost (the difference between $50 and $36) even though the price is $10.
Total Factor Cost Curve,
Monopsony |  |
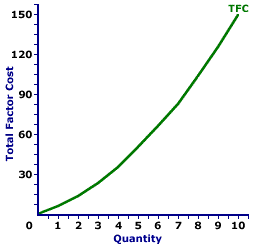
The total factor cost curve for the OmniKing Island Resort monopsony is displayed in the exhibit to the right. Key to this curve is that OmniKing is a monopsony buyer of workers and thus faces a positively-sloped supply curve. Larger quantities of input can be had only with higher prices.The vertical axis measures total factor cost and the horizontal axis measures the quantity of input (workers). Although quantity on this particular graph stops at 10 workers, it could go higher. This curve indicates that if OmniKing hires 1 worker (at $6 per worker), then it pays $6 of total factor cost. Alternatively, if it hires 10 workers (at $15 per worker), then it pays $150 of total factor cost. For OmniKing the total factor cost "curve" really is a "curve." The slope of this curve rises as more labor is hired. The changing slope of this curve is due to the changing price. Although this total factor cost curve is based on the employment activity of OmniKing Island Resort, a well-known monopsony firm, it applies to any buyer with market control. Monopsonistic competition and oligopsony firms that also face positively-sloped supply curves generate comparable total factor cost curves.

Recommended Citation:TOTAL FACTOR COST, MONOPSONY, AmosWEB Encyclonomic WEB*pedia, http://www.AmosWEB.com, AmosWEB LLC, 2000-2025. [Accessed: July 18, 2025].
Check Out These Related Terms... | | | | | | | | |
Or For A Little Background... | | | | | | | | | | | |
And For Further Study... | | | | | | | | |
Search Again?
Back to the WEB*pedia
|


|

|
BROWN PRAGMATOX
[What's This?]
Today, you are likely to spend a great deal of time browsing through a long list of dot com websites seeking to buy either a case of blank recordable DVDs or a pair of red goulashes with shiny buckles. Be on the lookout for mail order catalogs with hidden messages.
Your Complete Scope
This isn't me! What am I?
|

|
|
Lombard Street is London's equivalent of New York's Wall Street.
|

|
|
"A winner is someone who recognizes his God-given talents, works his tail off to develop them into skills, and uses those skills to accomplish his goals. " -- Larry Bird, basketball player
|

|
GAB
General Agreements to Borrow
|

|
|
Tell us what you think about AmosWEB. Like what you see? Have suggestions for improvements? Let us know. Click the User Feedback link.
User Feedback
|


|


