Marginal revenue is the extra revenue generated when a monopolistically competitive firm sells one more unit of output. It plays a key role in the profit-maximizing decision of a monopolistically competitive firm relative to marginal cost. A monopolistically competitive firm maximizes profit by equating marginal revenue, the extra revenue generated from production, with marginal cost, the extra cost of production. If these two marginals are not equal, then profit can be increased by producing more or less output.The relation between marginal revenue and the quantity of output produced depends on market structure. For a perfectly competitive firm, marginal revenue is equal to price and average revenue, all three of which are constant. For a monopoly, monopolistically competitive, or oligopoly firm, marginal revenue is less than average revenue and price, all three of which decrease with larger quantities of output. The constant or decreasing nature of marginal revenue is a prime indication of the market control of a firm.
Marginal revenue can be represented in a table or as a curve. For a perfectly competitive firm, the marginal revenue curve is a horizontal, or perfectly elastic, line. For a monopoly, oligopoly, or monopolistically competitive firm, the marginal revenue curve is negatively sloped.
The marginal revenue received by a monopolistically competitive firm is the change in total revenue divided by the change in quantity, often expressed as this simple equation:
| marginal revenue | = | change in total revenue
change quantity |
Market control means these market structures face negatively-sloped demand curves. As such, the price received is not fixed, but depends on the quantity of output sold, and so too does marginal revenue.A Table
Marginal Revenue,
Monopolistic Competition |  |
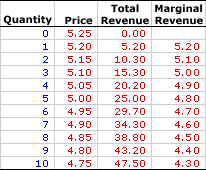
The table to the right summarizes the marginal revenue received by a hypothetical firm, Manny Mustard's House of Sandwich. Manny is one of thousands of restaurants in the greater Shady Valley metropolitan area that offers sandwiches and other meals to lunch-hungry buyers. Manny Mustard is a monopolistically competitive firm with minimal market control, facing a negatively-sloped demand curve. To sell a larger number of sandwiches, Manny Mustard must lower the price.The first column is the quantity of sandwiches sold, ranging from 0 to 10. The second column is the price Manny Mustard receives for selling this medicine, which ranges from $4.75 to $5.25 per sandwich. The third column is the total revenue Manny receives for producing and selling his sandwiches.
Marginal revenue in the forth column is found by dividing the change in total revenue (from the third column) by the change in quantity (from the first column). For example, when Manny Mustard increases production and sales from 4 sandwiches to 5, his total revenue increases from $20.20 to $25, an increase of $4.80. As such, the marginal revenue of producing the fifth sandwich is $4.80 (= $4.80/1). Each value in the fourth column is calculated in the same way.
One obvious point is that marginal revenue decreases with the quantity of sandwiches produced. A second point is that marginal revenue is less than the price of sandwiches for each quantity sold. The price of the fifth sandwich is $5, but the marginal revenue generated by the fifth sandwich is only $4.80. Marginal revenue is less than price. And because price is average revenue, marginal revenue is also less than average revenue.
The Curve
Marginal Revenue Curve,
Monopolistic Competition |  |
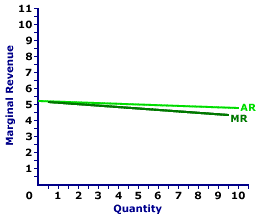
The marginal revenue curve (MR) for Manny Mustard is displayed in the exhibit to the right. Key to this curve is that Manny Mustard is a monopolistically competitive seller of sandwiches and thus faces a negatively-sloped demand curve. Larger quantities of output are only possible with lower prices.The vertical axis measures marginal revenue and the horizontal axis measures the quantity of output (number of sandwiches). Although quantity on this particular graph stops at 10 sandwiches, it could go higher.
This exhibit displays both the marginal revenue curve (MR) and the average revenue curve (AR), which is also the demand curve. Both are negatively sloped, but the marginal revenue curve lies below the average revenue curve, which means that marginal revenue is less than average revenue (and price) for any given quantity.
Although this marginal revenue curve, and preceding table of marginal revenue numbers, is based on the production activity of Manny Mustard, a well-known monopolistically competitive firm, they apply to any firm with market control. Monopoly and oligopoly firms that also face negatively-sloped demand curves generate comparable marginal revenue curves.
Marginal Revenue and Average Revenue
The preceding table of revenue values and marginal revenue graph suggest an extremely important point, marginal revenue values are less than the corresponding average revenue values (and price). Selling 5 sandwiches, for example, involves a price of $5. However, the marginal revenue that Manny Mustard receives for increasing the quantity from 4 sandwiches to 5 sandwiches is $4.80. Other quantities provide comparable results. Marginal revenue is less than price.How can this be? Why is this so? An explanation seems in order.
A simple explanation is that any decline in an average, which is most certainly happening to average revenue, is associated with a marginal that is less than the average. Because average revenue is decreasing, marginal revenue must be less than average revenue.
A more involved explanation might help.
Consider the situation facing Manny Mustard. If Manny sets his sandwich price at $5.05, then buyers are willing to purchase 4 sandwiches. However, if Manny wants to increase the quantity sold from 4 sandwiches to 5, then it MUST lower the price from $5.05 to $5 per sandwich. But here is the catch: Manny must lower the price for ALL, not just the extra sandwich.
What happens to Manny's total revenue when he lowers the price? Two forces are at work: (1) the revenue gained by adding extra sandwiches and (2) the revenue lost by lowering the price for existing sandwiches. Marginal revenue is the net result of both.
- First, by lowering his price, Manny increases the quantity sold from 4 to 5 sandwiches. This extra sandwich generates an extra $5 of revenue, the price of the fifth sandwich. This is $5 of extra revenue that Manny did NOT have at the higher price. If this is all that happens, then Manny has a marginal revenue of $5 for selling the fifth sandwich, equal to the price.
- Second, by lowering his price, Manny collects less revenue from his other 4 sandwiches. He would have collected $5.05 per sandwich for a total of $20.20. But with the lower $5 price he collects only $20, a reduction of total revenue by $0.20, or $0.05 per sandwich.
The $5 gained by selling the extra sandwich is partially offset by the $0.20 lost from lowering the price for other sandwiches. On net, total revenue increases by only $4.80. The loss of revenue collected on existing sandwiches is the key reason that marginal revenue is less than price.MARGINAL REVENUE, MONOPOLISTIC COMPETITION, AmosWEB Encyclonomic WEB*pedia, http://www.AmosWEB.com, AmosWEB LLC, 2000-2025. [Accessed: July 18, 2025].


