|
|
REGULATORY POLICY: Government policy based on government's ability to pass laws and enact regulations.
Visit the GLOSS*arama
|
|


|

|
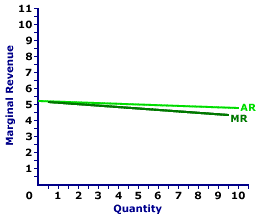
                           MARGINAL REVENUE CURVE, MONOPOLISTIC COMPETITION: A curve that graphically represents the relation between the marginal revenue received by a monopolistically competitive firm for selling its output and the quantity of output sold. Because a monopolistically competitive firm is a price maker and faces a negatively-sloped demand curve, its marginal revenue curve is also negatively sloped and lies below its average revenue (and demand) curve. A monopolistically competitive firm maximizes profit by producing the quantity of output found at the intersection of the marginal revenue curve and marginal cost curve. Monopolistic competition is a market structure with a large number of relatively small firms that sell similar but not identical products. Each firm is small relative to the overall size of the market such that it has some market control, but not much. In other words, it can sell a wide range of output at a narrow range of prices. This translates into a relatively elastic demand curve. If a monopolistically competitive firm wants to sell a larger quantity, then it must lower the price, but not by much.The marginal revenue curve reflects the degree of market control held by a firm. For a perfectly competitive firm, the marginal revenue curve is a horizontal, or perfectly elastic, line. For a monopoly, oligopoly, or monopolistically competitive firm, the marginal revenue curve is negatively sloped and lies below the average revenue (demand) curve. Marginal Revenue Curve,
Monopolistic Competition |  |
The marginal revenue curve (MR) for Manny Mustard is displayed in the exhibit to the right. Key to this curve is that Manny Mustard is a monopolistically competitive seller of sandwiches and thus faces a negatively-sloped demand curve. Larger quantities of output are only possible with lower prices.The vertical axis measures marginal revenue and the horizontal axis measures the quantity of output (number of sandwiches). Although quantity on this particular graph stops at 10 sandwiches, it could go higher. This exhibit displays both the marginal revenue curve (MR) and the average revenue curve (AR), which is also the demand curve. Both are negatively sloped, but the marginal revenue curve lies below the average revenue curve, which means that marginal revenue is less than average revenue (and price) for any given quantity. How can this be? Why is this so? An explanation seems in order. Consider the situation facing Manny Mustard. If Manny sets his sandwich price at $5.05, then buyers are willing to purchase 4 sandwiches. However, if Manny wants to increase the quantity sold from 4 sandwiches to 5, then he MUST lower the price from $5.05 to $5 per sandwich. But here is the catch: Manny must lower the price for ALL, not just the extra sandwich. What happens to Manny's total revenue when he lowers the price? Two forces are at work: (1) the revenue gained by adding extra sandwiches and (2) the revenue lost by lowering the price for existing sandwiches. Marginal revenue is the net result of both. - First, by lowering his price, Manny increases the quantity sold from 4 to 5 sandwiches. This extra sandwich generates an extra $5 of revenue, the price of the fifth sandwich. This is $5 of extra revenue that Manny did NOT have at the higher price. If this is all that happens, then Manny has a marginal revenue of $5 for selling the fifth sandwich, equal to the price.
- Second, by lowering his price, Manny collects less revenue from his other 4 sandwiches. He would have collected $5.05 per ounce for a total of $20.20. But with the lower $5 price he collects only $20, a reduction of total revenue by $0.20, or $0.05 per sandwich.
The $5 gained by selling the extra sandwich is partially offset by the $0.20 lost from lowering the price for other sandwiches. On net, total revenue increases by only $4.80--which is marginal revenue. The loss of revenue collected on existing sandwiches is the key reason that marginal revenue is less than price.Although this marginal revenue curve is based on the production activity of Manny Mustard, a monopolistically competitive firm, it applies to any firm with market control. Monopoly and oligopoly firms that also face negatively-sloped demand curves generate comparable marginal revenue curves.

Recommended Citation:MARGINAL REVENUE CURVE, MONOPOLISTIC COMPETITION, AmosWEB Encyclonomic WEB*pedia, http://www.AmosWEB.com, AmosWEB LLC, 2000-2025. [Accessed: July 18, 2025].
Check Out These Related Terms... | | | | | | | | | | |
Or For A Little Background... | | | | | | | | | | | |
And For Further Study... | | | | | | | |
Related Websites (Will Open in New Window)... | | | |
Search Again?
Back to the WEB*pedia
|


|

|
BLUE PLACIDOLA
[What's This?]
Today, you are likely to spend a great deal of time searching the newspaper want ads looking to buy either a wall poster commemorating the first day of winter or blue cotton balls. Be on the lookout for rusty deck screws.
Your Complete Scope
This isn't me! What am I?
|

|
|
Lombard Street is London's equivalent of New York's Wall Street.
|

|
|
"A winner is someone who recognizes his God-given talents, works his tail off to develop them into skills, and uses those skills to accomplish his goals. " -- Larry Bird, basketball player
|

|
VAT
Value Added Tax
|

|
|
Tell us what you think about AmosWEB. Like what you see? Have suggestions for improvements? Let us know. Click the User Feedback link.
User Feedback
|


|


