
|
|
INCOME TAX: A tax on income, including wages, rent, interest, profit, and (usually) transfer payments. The income tax system in the United States includes both a personal income tax and corporate income tax. In general, the U. S. income tax is progressive, but through a number of deductions and other loopholes, it's less so in practice that on paper.
Visit the GLOSS*arama
|
|


|

|
                           TOTAL UTILITY CURVE: A curve illustrating the relation between the total utility obtained from consuming a good and the quantity of the good consumed. The shape of the total utility curve, increasing at a decreasing rate, reflects the law of diminishing marginal utility. The reason for this is that slope of the total utility curve is marginal utility, meaning the total utility curve can be use to derive the marginal utility curve. The total utility curve is a cornerstone for consumer demand theory and utility analysis. It graphically captures the overall relation between the utility generated from a good and the quantity of the good consumed. This relation can them be used to derive marginal utility, which is critical to an understanding of market demand and the law of demand.| Roller Coaster Utility | 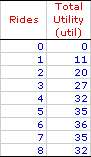 |
To set the stage for the total utility curve, consider the table of total utility values presented here. This table reports the total utility generated when Edgar Millbottom, Shady Valley's resident roller coaster aficionado, spends the day riding the Monster Loop Death Plunge roller coaster at the local Shady Valley Amusement Park. Edgar takes 8 separate rides on the Monster Loop Death Plunge roller coaster, graciously recording the total utility he accumulates after each ride.The task at hand is to plot these values into a graph. The graph below is ideally suited for the construction of the total utility curve for Edgar's 8 rides on the Monster Loop Death Plunge roller coaster. | Deriving Total Utility Curve | 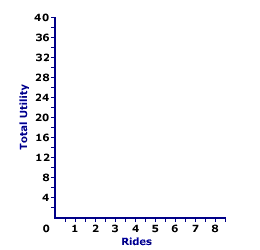 |
First, a few words about the existing graph. - The joined axes at the right present the plotting area.
- The horizontal axis measures quantity, the number of rides on the roller coaster. This ranges from 0 to 8.
- The vertical axis measures total utility, in utils, ranging from 0 to 40.
The next step is relatively easy. Click the "Plot" button to plot points indicating the total utility associated with each ride on the roller coaster. - If there are no rides, then total utility is 0 utils.
- After one ride, total utility 11 utils.
- After two rides, total utility 20 utils.
- After three ride, total utility 27 utils.
- And on it goes...
If the quantity consumed is continuously divisible, rather than coming in discrete amounts, then these nine points represent nine of an infinite number that capture the relation between total utility and quantity. To illustrate the other possible points, click the [Curve] button. The resulting line is the total utility curve.Consider these three observations about the curve. - The curve begins at the origin. If Edgar does not ride, then he receives no utility.
- The total utility curve is shaped something like a hill. It increases for the first 6 rides, then decreases for the rides 7 and 8. In general, Edgar's utility increases when he consumes a larger quantity.
- The total utility curve reaches a peak of 36 utils at 6 rides. This is the number of rides that maximizes Edgar's utility.
In closing, take note of the slope of the total utility curve. It rises, flattens, then turns negative. The slope of this total utility curve is marginal utility. The shape of the total utility curve means that marginal utility is high for small quantities, declines, then becomes negative as the quantity consumed increases. This decline in marginal utility and the flattening slope of the total utility curve reflect the law of diminishing marginal utility.
Recommended Citation:TOTAL UTILITY CURVE, AmosWEB Encyclonomic WEB*pedia, http://www.AmosWEB.com, AmosWEB LLC, 2000-2025. [Accessed: July 18, 2025].
Check Out These Related Terms... | | | |
Or For A Little Background... | | | | | | |
And For Further Study... | | | | | | | | | | | | | | | |
Search Again?
Back to the WEB*pedia
|

|

|
WHITE GULLIBON
[What's This?]
Today, you are likely to spend a great deal of time searching the newspaper want ads seeking to buy either an extra large beach blanket or a large flower pot shaped like a Greek urn. Be on the lookout for fairy dust that tastes like salt.
Your Complete Scope
This isn't me! What am I?
|

|
|
Woodrow Wilson's portrait adorned the $100,000 bill that was removed from circulation in 1929. Woodrow Wilson was removed from circulation in 1924.
|

|
|
"A winner is someone who recognizes his God-given talents, works his tail off to develop them into skills, and uses those skills to accomplish his goals. " -- Larry Bird, basketball player
|

|
IV
Instrumental Variables
|

|
|
Tell us what you think about AmosWEB. Like what you see? Have suggestions for improvements? Let us know. Click the User Feedback link.
User Feedback
|

|






