|
|
AGGREGATE MARKET ANALYSIS: An investigation of macroeconomic phenomena, including unemployment, inflation, business cycles, and stabilization policies, using the aggregate market interaction between aggregate demand, short-run aggregate supply, and long-run aggregate supply. Aggregate market analysis, also termed AS-AD analysis, has been the primary method of investigating macroeconomic activity since the 1980s, replacing Keynesian economic analysis that was predominant for several decades. Like most economic analysis, aggregate market analysis employs comparative statics, the technique of comparing the equilibrium after a shock with the equilibrium before a shock. While the aggregate market model is usually presented as a simply graph at the introductory level, more sophisticated and more advanced analyses often involve a system of equations.
Visit the GLOSS*arama
|
|


|

|
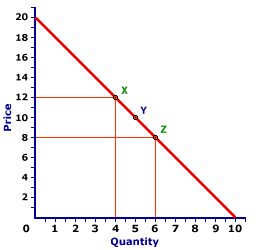
                           ARC ELASTICITY: The average elasticity for discrete changes in two variables. The distinguishing characteristic of arc elasticity is that percentage changes are calculated based on the average of initial and ending values of each variable, rather than initial values. Arc elasticity is generally calculated using the midpoint elasticity formula. The contrast to arc elasticity is point elasticity. For infinitesimally small changes in two variables, arc elasticity is the same as point elasticity. Arc elasticity is best considered the average elasticity over a range of values for a relation. Like any average, some values within the range are likely to be greater and some less. However, it provides a quick approximation of elasticity when more precise and sophisticated calculation techniques are not possible.Working Through an Example| A Standard Demand Curve |  |
The demand curve displayed to the right can be used to illustrate the measurement of arc elasticity using the midpoint elasticity formula. If the price declines from $12 to $8, the quantity demanded increases from 4 to 6, from point X to point Z. Using this midpoint formula (with price designated as P and quantity designated as Q) average price elasticity of demand is:midpoint
elasticity | = | (Q[Z] - Q[X])
(Q[Z] + Q[X])/2 | ÷ | (P[Z] - P[X])
(P[Z] + P[X])/2 |
midpoint
elasticity | = | (6 - 4)
(6 + 4)/2 | ÷ | (8 - 12)
(8 + 12)/2 | = | (2)
(5) | ÷ | (-4)
(10) |
midpoint
elasticity | = | 0.4 | ÷ | -0.4 | = | -1.0 |
Ignoring the minus sign, the price elasticity of demand over this segment of the demand curve from X to Z is 1.0.An Average ValueThis value of 1.0 is actually an average for the entire range between points X and Z. Precise estimates of point elasticity shows that the elasticity is 0.67 at point X and 1.5 at point Z. Moreover, the elasticity is different at each point on a straight line demand curve such as this one. The only point in which the elasticity is exactly equal to 1.0 is at point Y, the midpoint between X and Z.This last observation is worth emphasizing. The midpoint elasticity formula effectively estimates the point elasticity at the very midpoint of the overall segment. This means that the elasticity of any point on a demand curve (point elasticity) can be obtained by calculating the arc elasticity with the midpoint elasticity formula such that the desired point is dead center in the middle, the midpoint of the arc.

Recommended Citation:ARC ELASTICITY, AmosWEB Encyclonomic WEB*pedia, http://www.AmosWEB.com, AmosWEB LLC, 2000-2025. [Accessed: July 18, 2025].
Check Out These Related Terms... | | | | | |
Or For A Little Background... | | | | | |
And For Further Study... | | | | | |
Search Again?
Back to the WEB*pedia
|


|

|
PINK FADFLY
[What's This?]
Today, you are likely to spend a great deal of time calling an endless list of 800 numbers wanting to buy either a weathervane with a cow on top or a box of multi-colored, plastic paper clips. Be on the lookout for high interest rates.
Your Complete Scope
This isn't me! What am I?
|

|
|
The average bank teller loses about $250 every year.
|

|
|
"A winner is someone who recognizes his God-given talents, works his tail off to develop them into skills, and uses those skills to accomplish his goals. " -- Larry Bird, basketball player
|

|
PBOT
Phildelphia Board of Trade
|

|
|
Tell us what you think about AmosWEB. Like what you see? Have suggestions for improvements? Let us know. Click the User Feedback link.
User Feedback
|


|


