
|
|
LOCAL BONDS: Also called municipal bonds, these are medium or long-term financial instruments issued by municipalities to borrow the funds used to build schools, highways, parks and other public projects. An attractive feature of these financial instruments is that are exempt from federal income tax. Commercial banks, corporations, and others with large sums of funds to lend usually purchase these bonds.
Visit the GLOSS*arama
|
|


|

|
                           ARC ELASTICITY: The average elasticity for discrete changes in two variables. The distinguishing characteristic of arc elasticity is that percentage changes are calculated based on the average of initial and ending values of each variable, rather than initial values. Arc elasticity is generally calculated using the midpoint elasticity formula. The contrast to arc elasticity is point elasticity. For infinitesimally small changes in two variables, arc elasticity is the same as point elasticity. Arc elasticity is best considered the average elasticity over a range of values for a relation. Like any average, some values within the range are likely to be greater and some less. However, it provides a quick approximation of elasticity when more precise and sophisticated calculation techniques are not possible.Working Through an Example| A Standard Demand Curve | 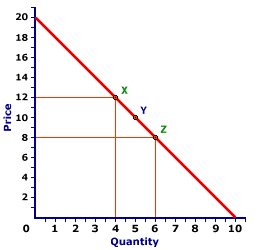 |
The demand curve displayed to the right can be used to illustrate the measurement of arc elasticity using the midpoint elasticity formula. If the price declines from $12 to $8, the quantity demanded increases from 4 to 6, from point X to point Z. Using this midpoint formula (with price designated as P and quantity designated as Q) average price elasticity of demand is:midpoint
elasticity | = | (Q[Z] - Q[X])
(Q[Z] + Q[X])/2 | ÷ | (P[Z] - P[X])
(P[Z] + P[X])/2 |
midpoint
elasticity | = | (6 - 4)
(6 + 4)/2 | ÷ | (8 - 12)
(8 + 12)/2 | = | (2)
(5) | ÷ | (-4)
(10) |
midpoint
elasticity | = | 0.4 | ÷ | -0.4 | = | -1.0 |
Ignoring the minus sign, the price elasticity of demand over this segment of the demand curve from X to Z is 1.0.An Average ValueThis value of 1.0 is actually an average for the entire range between points X and Z. Precise estimates of point elasticity shows that the elasticity is 0.67 at point X and 1.5 at point Z. Moreover, the elasticity is different at each point on a straight line demand curve such as this one. The only point in which the elasticity is exactly equal to 1.0 is at point Y, the midpoint between X and Z.This last observation is worth emphasizing. The midpoint elasticity formula effectively estimates the point elasticity at the very midpoint of the overall segment. This means that the elasticity of any point on a demand curve (point elasticity) can be obtained by calculating the arc elasticity with the midpoint elasticity formula such that the desired point is dead center in the middle, the midpoint of the arc.
Recommended Citation:ARC ELASTICITY, AmosWEB Encyclonomic WEB*pedia, http://www.AmosWEB.com, AmosWEB LLC, 2000-2025. [Accessed: July 1, 2025].
Check Out These Related Terms... | | | | | |
Or For A Little Background... | | | | | |
And For Further Study... | | | | | |
Search Again?
Back to the WEB*pedia
|

|

|
BEIGE MUNDORTLE
[What's This?]
Today, you are likely to spend a great deal of time touring the new suburban shopping complex looking to buy either a genuine down-filled pillow or one of those "hang in there" kitty cat posters. Be on the lookout for defective microphones.
Your Complete Scope
This isn't me! What am I?
|

|
|
The New York Stock Exchange was established by a group of investors in New York City in 1817 under a buttonwood tree at the end of a little road named Wall Street.
|

|
|
"Experience keeps a dear school, but fools will learn in no other. " -- Benjamin Franklin
|

|
BPEA
Brookings Papers on Economic Activity
|

|
|
Tell us what you think about AmosWEB. Like what you see? Have suggestions for improvements? Let us know. Click the User Feedback link.
User Feedback
|

|

