|
|
A: The common notation for the "intercept" term of an equation specified as Y = a + bX. Mathematically, the a-intercept term indicates the value of the Y variable when the value of the X variable is equal to zero. Theoretically, the a-intercept is frequently used to indicate exogenous or independent influences on the Y variable, that is, influences that are independent of the X variable. For example, if Y represents consumption and X represents national income, a measures autonomous consumption expenditures.
Visit the GLOSS*arama
|
|


|

|
                           COLLUSION PRODUCTION ANALYSIS: To avoid competition, oligopolistic firms are occasionally inclined to cooperate through collusion. Collusion occurs when two or more oligopolistic firms jointly agree to control market prices and quantity and to generally act like a monopoly. Colluding firms set a price and produce a quantity that maximizes industry-wide economic profit, the same price and quantity that would be selected by a profit-maximizing monopoly. Once the industry-wide price and production are determined, each individual firm produces the quantity of output that equates the marginal cost of the firm to the marginal revenue for the industry. Collusion production analysis illustrates how two or more colluding firms control market price and quantity to maximize industry-wide profit. This is accomplished by setting industry-wide marginal revenue equal to industry-wide marginal cost. Once the industry-wide profit maximization price and quantity are determined, each colluding firm produces a quantity that equates its own marginal cost with industry-wide marginal revenue.This analysis of collusion production is essentially the same as the analysis of a cartel that maximizes industry-wide profit output and a profit-maximizing monopoly that operates more than one plant or factory. The only difference between these three analyses is the underlying "structure" of the "monopoly." With collusion, independently-owned oligopolistic firms secretly agree to act like a monopoly. With a cartel, independently-owned oligopolistic firms openly agree to act like a monopoly. And with a multiplant monopoly, each "firm" is owned outright by the monopoly. Industry-Wide Marginal Cost CurveThe first step in collusion production analysis is to identify the industry-wide marginal cost. To illustrate how this is accomplished, consider the hypothetical Shady Valley soft drink market, featuring two dueling oligopolistic firms--OmniCola and Juice-Up. To simplify this analysis, assume that the market includes only these two firms.After years of intense, expensive competition, OmniCola and Juice-Up decide to pursue a little cooperation... and a little collusion. They decide to work together, setting a market price and producing a market quantity as if a monopoly controlled the market. The only difference between this collusive "monopoly" and a traditional monopoly is that two separate production "plants" are used, one operated by OmniCola and the other by Juice-Up. | Industry-Wide Marginal Cost | 
|
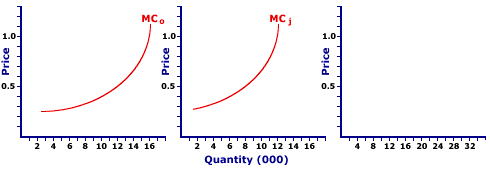
This exhibit presents the marginal cost curves for OmniCola and Juice-Up. The far left panel presents OmniCola's marginal cost curve (MCo) and the center panel presents that for Juice-Up (MCj). The marginal cost curves look essentially the same for both firms, but that for OmniCola lies a little farther to the right, meaning production cost is a lower for a given production.The far right panel is momentarily empty. It is awaiting a key component of this analysis--the industry-wide marginal cost curve. This curve indicates the incremental change in industry-wide production cost for each extra can of soft drink produced. In some cases, the extra can is produced by OmniCola and in other cases it is produced by Juice-Up. In effect, OmniCola and Juice-Up combine their individual marginal cost curves (MCo and MCj) into a single curve. OmniCola and Juice-Up produce cans of soft drink using the firm with the lowest marginal cost. From a graphical standpoint, this is accomplished by horizontally summing the two marginal cost curves. Consider how this works. - Suppose the colluding firms want to produce soft drinks at a marginal cost that is equal to $0.30 per can. Two questions to ask are: (1) How many cans would each firm produce? (2) What is the total production by both firms? Click the [$0.30] button to help answer both questions.
- In the first panel, OmniCola is able to produce 7,000 cans of soft drinks at this $0.30 marginal cost. In the second panel, Juice-Up is able to produce 3,000 cans of soft drinks at this $0.30 marginal cost. The quantity difference between OmniCola and Juice-Up is caused by differences in production technology and cost. OmniCola is simply more productive than Juice-Up.
- The total quantity of soft drinks produced by both firms at $0.30 is then the sum of 7,000 and 3,000, which is 10,000 cans. This combination of marginal cost and quantity is one point on the industry marginal cost curve for the colluding firms.
However, for the complete curve the marginal cost of producing other quantities is also needed. To generate this curve, the total quantity of output that both firms can produce at each marginal cost is identified. Consider a couple of additional marginal cost values.- A $0.40 marginal cost generates 10,000 cans by OmniCola and 6,000 by Juice-Up, for a market total of 16,000 cans. Click the [$0.40] button to illustrate.
- A $0.50 marginal cost generates 12,000 cans by OmniCola and 8,000 by Juice-Up, for a market total of 20,000 cans. Click the [$0.50] button to illustrate.
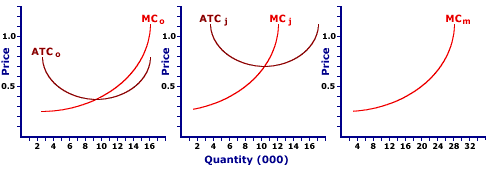
To trace out the all remaining points click the [Industry MC] button. This displays the market-wide marginal cost curve, labeled MCm that lets the colluding firms operate like a monopoly.Maximizing Industry-Wide Profit| Profit-Maximizing Collusion Production | 
|
With the marginal cost curve identified for the industry, the maximization of industry-wide profit can be identified. This exhibit replicates the marginal cost curves for OmniCola and Juice-Up, as well as the industry-wide marginal cost curve. Two additional curves are thrown into the mix--the average total cost for OmniCola (ATCo) and the average total cost for Juice-Up (ATCj). These will be important momentarily.Identifying the industry-wide profit maximization requires the revenue side of the soft drink market. This can be easily accomplished with a click of the [Demand] button. Doing so displays the market demand curve (D) and the corresponding marginal revenue curve (MR). This is the marginal revenue generated as the two colluding oligopolistic firms act like a monopoly. Now, consider how the colluding firms set price and quantity. - First the Quantity: With the marginal cost (MCm) and marginal revenue (MR) curves in place, the next task is to identify the profit-maximization production level. This occurs at the intersection of MCm and MR, which is 16,000 cans of soft drink. Click the [Quantity] button to illustrate.
- Next the Price: Identifying the price that this colluding monopoly charges works just like a regular monopoly. With a quantity of 16,000 cans, buyers are willing and able to pay a price of $1.00 as indicated by the market demand curve. This is the price that OmniCola and Juice-Up charge for soft drinks. Click the [Price] button to illustrate.
- Now Dividing Production: The next step is to divide the 16,000 cans of production between OmniCola and Juice-Up. This is done by noting the marginal cost of producing 16,000 cans is $0.40. OmniCola produces 10,000 at this marginal cost and Juice-Up produces 6,000 cans. Click the [Dividing Up] button to illustrate.
- Finally Profit: The profit received by each of the two colluding firms can be identified by extending the $1.00 price to the first two panels, then noting the average total cost of producing the designated output by each of the two firms. The difference between average cost and price, multiplied by the quantity produced, is the profit. Click the [Profit] button to illustrate the yellow rectangular profit areas for each firm.
What have these colluding soft-drink firms accomplished. They have maximized total industry profit by producing the quantity of output in which the marginal cost of each firm is equal to the marginal revenue for the overall market. Each firm then produces the specific quantity achieved at this marginal cost.The general profit-maximizing formula for colluding oligopolistic firms is: marginal revenue
for industry | = | marginal cost
for firm 1 | = | marginal cost
for firm 2 |
When this condition is satisfied, then total industry profit is maximized. If the industry has more than two firms, then they too must produce output such that their marginal cost is equal to that of every other firm and to the industry marginal revenue.A Little CheatingThe problem with a collusive agreement is that each firm has the incentive to cheat. Consider OmniCola's predicament. At the $1.00, it can increase profit by producing up to 16,000 cans, the quantity at which the $1.00 price intersects its marginal cost curve. Juice-Up can increase profit in a similar manner, by increasing production to 12,000 cans.However, if both firms increase production to a total of 28,000 cans, then the price that buyers are willing to pay declines to $0.50. This price decline then defeats the purpose of colluding. Collusion agreements always face this balancing act. Each firm can do better under collusion than standard competition. However, under the collusion agreement, each firm can do better if they cheat--so long as the other firms maintain the agreement and the higher price. But with every firm motivated to cheat, the agreement is prone to fall apart, returning the firms to the original competitive situation.

Recommended Citation:COLLUSION PRODUCTION ANALYSIS, AmosWEB Encyclonomic WEB*pedia, http://www.AmosWEB.com, AmosWEB LLC, 2000-2025. [Accessed: June 30, 2025].
Check Out These Related Terms... | | | |
Or For A Little Background... | | | | | | | |
And For Further Study... | | |
Search Again?
Back to the WEB*pedia
|


|

|
WHITE GULLIBON
[What's This?]
Today, you are likely to spend a great deal of time at a dollar discount store wanting to buy either a wall poster commemorating the first day of spring or a lazy Susan for you dining room table. Be on the lookout for cardboard boxes.
Your Complete Scope
This isn't me! What am I?
|

|
|
Potato chips were invented in 1853 by a irritated chef repeatedly seeking to appease the hard to please Cornelius Vanderbilt who demanded french fried potatoes that were thinner and crisper than normal.
|

|
|
"I learned about the strength you can get from a close family life. I learned to keep going, even in bad times. I learned not to despair, even when my world was falling apart. I learned that there are no free lunches. And I learned the value of hard work. " -- Lee Iacocca
|

|
FASB
Financial Accounting Standards Board
|

|
|
Tell us what you think about AmosWEB. Like what you see? Have suggestions for improvements? Let us know. Click the User Feedback link.
User Feedback
|


|


