|
|
PRESENT VALUE: The amount of money today that, after interest is added, would have the same value as an amount some time in the future. For example, $100 today, given a 10 percent interest rate, would have a value of $110 in one year ($100 plus $10 in interest). Conversely, $110 in one year, given a 10 percent interest rate, would be equivalent to $100 today. The process of translating a future payment into its present value, such an amount to be received when a bond reaches its date of maturity, is often termed discounting.
Visit the GLOSS*arama
|
|


|

|
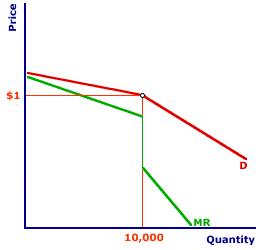
                           KINKED-DEMAND CURVE ANALYSIS: An analysis using the kinked-demand curve to explain rigid prices often found with oligopoly. The kinked-demand curve contains two distinct segments--one for higher prices that is more elastic and one for lower prices that is less elastic. Key to this analysis is that the corresponding marginal revenue curve contains three segments--one associated with the more elastic segment, one associated with the less elastic segment, and one associated with the kink. A profit-maximizing firm can then equate marginal cost to a wide range of marginal revenue values along the vertical segment of the marginal revenue curve. This suggests that marginal cost must change significantly before an oligopolistic firm is inclined to change price. The kinked-demand curve analysis of oligopoly builds on the notion of interdependent decision-making to explain why prices tend to be relative stable or rigid. The key to this analysis is that competing firms do not respond in the same way when one firm increases or decreases its price. Competing firms match price decreases, but not price increases. This means a firm is likely to lose market share for price increases, but does not gain market share for price decreases. A firm has little to gain from reducing prices and much to lose form raising prices. As such, the firm is inclined to keep prices stable.A Kinked-Demand Summary| Kinked OmniCola Demand |  |
The exhibit the right presents a typical kinked-demand curve, and corresponding marginal revenue curve, facing an oligopolistic firm. This particular curve is that for the hypothetical Shady Valley soft drink supplier, OmniCola.- Existing Price and Quantity: The initial price is $1 per can and the initial quantity sold is 10,000 cans. The "kink" in the demand curve occurs at this price and quantity. Note that this analysis does not explain how the existing price and quantity came to be $1 per can and 10,000 cans. It only indicates how the firm reacts given this is the starting price and quantity.
- Demand Curve: The demand curve facing OmniCola contains two segments. For prices above $1 and quantities less that 10,000 cans, the demand curve is more elastic. If OmniColan increases its price, other firms do not. As such, OmniCola loses market share and sees a significant decrease in quantity demanded. For prices below $1 and quantities greater that 10,000 cans, the demand curve is less elastic. If OmniCola decreases its price, so too do other firms. As such, OmniCola does not gain market share and sees only a minimal increase in quantity demanded.
- Marginal Revenue Curve: The marginal revenue curve facing OmniCola contains three segments. For quantities less that 10,000 cans, the marginal revenue curve is relatively flat. This segment is derived from the more elastic demand curve segment associated with higher prices and lesser quantities. For quantities greater that 10,000 cans, the marginal revenue curve is relatively steep. This segment is derived from the less elastic demand curve segment associated with lower prices and greater quantities. At exactly 10,000 cans, the marginal revenue curve is vertical. This segment is associated with the kink of the demand curve that connects the more elastic segment with the less elastic segment.
Profit Maximization| Constant Prices |  |
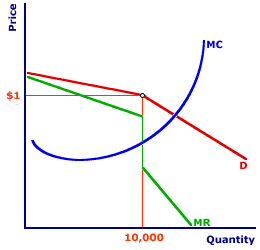
Profit maximization is achieve with the equality between marginal revenue and marginal cost. The graph to the right displays the kinked-demand curve for OmniCola and the corresponding marginal revenue curve. The missing component of this analysis is the marginal cost curve. A click of the [Marginal Cost] button reveals OmniCola's marginal cost curve.By design, this marginal cost curve intersects the vertical segment of OmniCola's marginal revenue curve, at $0.60 and 10,000 cans. In particular, this equality between marginal revenue and marginal cost generates a profit-maximizing equilibrium at the initial quantity of 10,000 cans. Given the demand facing OmniCola and given OmniCola's production cost, OmniCola cannot generate any greater profit than it does by producing 10,000 cans that are sold for $1 each. Changing CostThe key to this analysis, however, is what happens to OmniCola's profit-maximizing decision when marginal cost changes. - Higher Cost: First, suppose that the price of sugar increases. As a critical input in the production of OmniCola, this increases cost. In particular, marginal cost increases and the marginal cost curve shifts leftward (and upward). Click the [Higher Cost] button to illustrate this shift.
This shift of the marginal cost curve generates a new intersection between marginal revenue and marginal cost at a value of $0.75 and a quantity of 10,000 cans. This intersection remains on the vertical segment of the marginal revenue curve. OmniCola maximizes profit by producing 10,000 cans sold for $1 each. This is the same profit-maximizing price and quantity combination that OmniCola had BEFORE the change in marginal cost.
OmniCola can endure an increase in cost without changing the profit-maximizing price and quantity combination from the initial level.
- Lower Cost: Now, suppose that wages paid to the OmniCola workers decline, resulting in a decrease in production cost. In this case, marginal cost decreases and the marginal cost curve shifts rightward (and downward). Click the [Lower Cost] button to illustrate this shift.
This shift of the marginal cost curve generates a new intersection between marginal revenue and marginal cost at a value of $0.50 and a quantity of 10,000 cans. This intersection is also on the vertical segment of the marginal revenue curve. OmniCola maximizes profit by producing 10,000 cans sold for $1 each. This is also the same profit-maximizing price and quantity combination that OmniCola had BEFORE the change in marginal cost.
OmniCola also can enjoy a decrease in cost without changing the profit-maximizing price and quantity combination from its initial level.
This generates the key conclusion from the kinked-demand curve analysis. An oligopolistic firm facing a kinked-demand curve produces the same quantity AT THE SAME PRICE for significant increases and decreases in marginal cost. In other words, OmniCola does not automatically pass along higher or lower production cost to the buyers. Interdependent decision-making and other firms in the industry prevent OmniCola from passing cost changes to buyers.OmniCola has to absorb higher production cost with less profit. However, OmniCola receives a boost in profit should production cost fall. Limits| Changing Prices |  |
There are limits to the production cost change that Omnicola will absorb. - Sufficiently large increases in production cost force OmniCola to reduce production and charge a higher price. Click the [Really High Cost] button to illustrate. In this case the leftward/upward shift of the marginal cost curve is so great that OmniCola maximizes profit by reducing production to 5,000 cans and raising the price to $1.10 per can.
- Sufficiently large decreases in production cost also induce OmniCola to increase production and charge a lower price. Click the [Really Low Cost] button to illustrate. In this case the rightward/downward shift of the marginal cost curve is so great that OmniCola maximizes profit by increasing production to 12,000 cans and lowering the price to $0.90 per can.
LimitsThis kinked-demand curve analysis illustrates why oligopolistic firms might keep prices relatively rigid. The explanation rests with interdependent decision-making among oligopolistic firms. Higher prices are not matched by other firms, but lower prices are.However, this analysis ONLY indicates why prices do not change. It does not explain why or how prices are established in the first place. Why, for example, is the initial price of OmniCola $1? The kinked-demand curve analysis offers no insight. Suppose that OmniCola experiences relatively big increases or decreases in marginal cost such that a new profit-maximizing price and quantity is selected. What happens to the kink? What happens if marginal cost changes again? Is a new kink immediately formed at the 5,000 can quantity and $1.10 price should marginal cost shift leftward and upward? If production cost increases on Monday, then decreases on Tuesday, does OmniCola return to the "original" price-quantity combination of $1 and 10,000 or is a "new" rigid price established at $1.10 and the 5,000 can quantity? If a new kink is not established immediately, how long does OmniCola need to operate at the 5,000 can quantity and $1.10 price before it becomes the "initial" price and quantity? A week? A month? A year? These are the sorts of questions that are NOT answered by the kinked-demand curve analysis. This analysis only illustrates why prices remain rigid, NOT how prices are determined in the first place.

Recommended Citation:KINKED-DEMAND CURVE ANALYSIS, AmosWEB Encyclonomic WEB*pedia, http://www.AmosWEB.com, AmosWEB LLC, 2000-2025. [Accessed: July 3, 2025].
Check Out These Related Terms... | | | |
Or For A Little Background... | | | | | | | | | | | |
And For Further Study... | | |
Search Again?
Back to the WEB*pedia
|


|

|
GRAY SKITTERY
[What's This?]
Today, you are likely to spend a great deal of time at a going out of business sale looking to buy either a wall poster commemorating the 2000 Presidential election or a rechargeable flashlight. Be on the lookout for fairy dust that tastes like salt.
Your Complete Scope
This isn't me! What am I?
|

|
|
A half gallon milk jug holds about $50 in pennies.
|

|
|
"Far and away the best prize that life has to offer is the chance to work hard at work worth doing." -- Theodore Roosevelt, 26th US president
|

|
ICCH
International Commodities Clearing House
|

|
|
Tell us what you think about AmosWEB. Like what you see? Have suggestions for improvements? Let us know. Click the User Feedback link.
User Feedback
|


|


