
|
|
LEAKAGE LINE: A line used in the injection-leakage model representing the relation between non-consumption uses of income (that is, leakages) and national income. The three leakages are saving, taxes, and imports. The foundation of the leakages line is the saving line, which is then enhanced by adding taxes and imports. The other part of the injection-leakage model is a line representing injections. The intersection of the injection and leakage lines identifies equilibrium aggregate output, or Keynesian equilibrium.
Visit the GLOSS*arama
|
|


|

|
                           MONOPOLISTIC COMPETITION, SHORT-RUN PRODUCTION ANALYSIS: A monopolistically competitive firm produces the profit-maximizing quantity of output that equates marginal revenue and marginal cost. This production level can be identified using total revenue and cost, marginal revenue and cost, or profit. Because a monopolistically competitive firm faces a negatively-sloped demand curve, it does not efficiently allocate resources by equating price and marginal cost. Monopolistic competition is a market structure with a large number of relatively small firms that sell similar but not identical products. Each firm is small relative to the overall size of the market such that it has some market control, but not much. In other words, it can sell a wide range of output at a narrow range of prices. This translates into a relatively elastic demand curve. If a monopolistically competitive firm wants to sell a larger quantity, then it must lower the price, but not by much.Comparable to any profit-maximizing firm, a monopolistically competitive firm produces the quantity of output in the short run that equates marginal revenue with marginal cost. At this production level, the firm cannot increase profit by changing the level of production. Because price is not equal to marginal revenue, a monopolistically competitive firm does not produce the quantity of output that equates price and marginal cost, which means it does not efficiently allocate resources. Determining OutputA monopolistically competitive firm is presumed to produce the quantity of output that maximizes economic profit--the difference between total revenue and total cost. This production decision can be analyzed in three different, but interrelated ways.- Profit: The first is directly through the analysis of economic profit, especially using a profit curve that traces the level of economic profit for different levels of output.
- Total Revenue and Cost: A second is by comparing total revenue and total cost, commonly accomplished with total revenue and total cost curves.
- Marginal Revenue and Cost: The third, and perhaps most noted, way is by comparing marginal revenue and marginal cost, similarly achieved with marginal revenue and marginal cost curves.
The profit-maximization production decision facing a monopolistically competitive firm can be analyzed using the exhibit below. This table presents revenue and cost information for Manny Mustard, a hypothetical example of a monopolistically competitive firm by virtue of its production of Deluxe Club Sandwiches, a highly competitive but slightly differentiated luncheon product.Profit Maximization,
Monopolistic Competition | 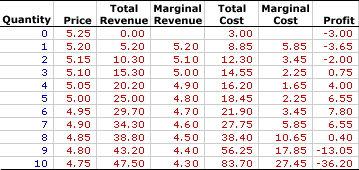 |
- Quantity: The first column presents the quantity of output produced, ranging from 0 to 10 sandwiches.
- Price: The second column presents the price at each output level, ranging from $5.25 for no output to $4.75 for 10 sandwiches. The first two columns combined represent the demand Manny faces for selling sandwiches.
- Total Revenue: The third column presents total revenue, ranging from a low of $0 for no output to a high of $47.50 for 10 sandwiches.
- Marginal Revenue: The fourth column presents marginal revenue, the change in total revenue due to a change in the quantity, which declines from a high of $5.20 to a low of $4.30.
- Total Cost: The fifth column presents the total cost incurred by Manny Mustard in the production of his Deluxe Club Sandwiches, ranging from a low of $3 for zero output (which is also fixed cost) to a high of $83.70 for 10 sandwiches.
- Marginal Cost: The sixth column presents the marginal cost, the change in total cost due to a change in the quantity, which declines from $5.85, reaches a low of $1.65, then rises until reaching $27.45.
- Profit: The seventh column at the far right of the table is profit, the difference between total revenue in the second column and total cost in the third column. It begins at -$3, drops a bit, rises to $7.80, then falls to -$36.20.
The choice facing Manny Mustard is to produce the quantity of sandwiches that maximizes profit. This can be easily identified using the far right "Profit" column. The quantity that generates the greatest level of economic profit is 6 sandwiches. This alternative can be highlighted by clicking the [Profit Max] button.The production of 6 sandwiches results in $34.30 of total revenue and $27.75 of total cost, a difference of $7.80. No other production level generates a greater economic profit. Producing one more sandwich or one less sandwich reduces profit to $6.55. The price that achieves this profit-maximizing quantity is $4.95. While marginal revenue and marginal cost might not appear to be equal for the profit-maximizing production of 6 sandwiches ($4.70 versus $3.45), they really are. The reason is that the marginal numbers in the table actually represent discrete changes from one sandwich to the next. Reducing the size of the discrete change, say from 5.9999 sandwiches to 6 sandwiches, results in a marginal revenue that is actually closer to $4.65. The same is true for marginal cost. At the limit of an infinitesimally small change, both marginal cost and marginal revenue are exactly $4.65. Total Curves| Total Revenue and Cost | 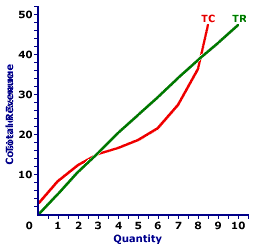 |
The short-run production decision for a monopolistically competitive firm can be graphically illustrated using total revenue and total cost curves, such as those displayed in the exhibit to the right. These total curves represent the total revenue and cost of sandwiches production by Manny Mustard's House of Sandwich.- Total Revenue: The slightly curved green line depicts the total revenue Manny Mustard receives from sandwich production. The line is curved because Manny Mustard must lower the price to sell a larger quantity.
- Total Cost: The even more curvy red line depicts the total cost Manny Mustard incurs in the production of sandwiches. The shape is based on increasing, then decreasing marginal returns.
- Profit: The vertical difference between these two lines is economic profit. If the total revenue line is above the total cost line in the middle of the diagram, economic profit is positive. If the total revenue line is below the total cost line at the far right and far left, economic profit is negative.
The key for Manny Mustard is to identify the production level that gives the greatest vertical distance between the total revenue and total cost curves in the middle of the diagram. This might not be evident by just looking at the exhibit, but it can be highlighted by clicking the [Profit Max] button. The output quantity identified is, once again, 6 sandwiches.Marginal Curves| Marginal Revenue and Cost | 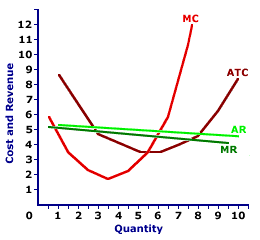 |
Perhaps the most common method of identifying the profit-maximizing level of production for a monopolistically competitive firm is using marginal revenue and marginal cost curves, such as those displayed in this exhibit.- Marginal Revenue: The negatively-sloped dark green line, labeled MR, is the marginal revenue Manny Mustard receives for each extra sandwich sold.
- Marginal Cost: The red U-shaped curve, labeled MC, is the marginal cost Manny Mustard incurs in the production of sandwiches. The shape is based on increasing, then decreasing marginal returns.
- Average Revenue: The negatively-sloped light green line (AR) is the average revenue Manny Mustard receives from selling sandwiches, which is also the demand curve.
- Average Total Cost: The additional U-shaped curve included in the diagram (just for good measure) is average total cost (ATC). This curve is helpful when identifying the level of economic profit that a firm receives.
In this analysis, Manny Mustard needs to identify the quantity of output that achieves an equality between marginal revenue and marginal cost. This production can be highlighted by clicking the [Profit Max] button. The highlighted quantity is once again 6 sandwiches. The price charged by Manny Mustard to sell this quantity is $4.95.Production Alternatives| Profit and Loss | 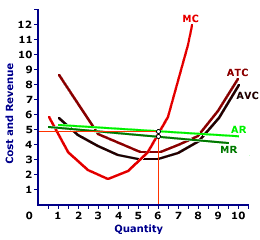 |
Even though monopoly is slightly more likely to earn economic profit than a perfectly competitive firm, it is not guaranteed an economic profit. Should demand conditions change, it might also incur an economic loss or be forced to shut down in the short run. Comparable to any firm, a monopolistically competitive firm faces three short-run production alternatives based on a comparison of price, average total cost, and average variable cost.- P > ATC: Total revenue exceeds total cost and Manny Mustard receives a positive economic profit. In this case, Manny Mustard maximizes profit by producing the quantity of output that equates marginal revenue and marginal cost. More to the point, the price that Manny Mustard charges at the profit-maximizing quantity is greater than average total cost. This is the initial situation displayed in the graph.
- ATC > P > AVC: Total revenue falls short of total cost, meaning Manny Mustard incurs an economic loss (or negative economic profit). This option can be displayed by clicking the [Less Demand] button. In spite of the loss, because the price set at the profit-maximizing production level exceeds average variable cost, Manny Mustard can minimize loss by producing the indicated quantity of output. Manny Mustard receives enough revenue to cover ALL variable cost plus a portion of fixed cost. The loss from production is less than the loss from NOT producing, which is total fixed cost.
- P < AVC: Total revenue also falls short of total cost, and Manny Mustard incurs an economic loss (or negative economic profit) that exceeds total fixed cost. This option can be displayed by clicking the [Even Less Demand] button. In this case Manny Mustard minimizes losses by reducing the quantity of output to zero, or producing no output in the short run. By producing a positive quantity, Manny Mustard does not receive enough revenue to cover variable cost, let alone any fixed cost. The economic loss from producing is greater than the economic loss of NOT producing, which is total fixed cost.
Short-Run Supply Curve?Market control means that monopolistic competition does necessarily not have a supply relation between the quantity of output produced and the price. By way of comparison a perfectly competitive firm has a short-run supply curve based on the positively-sloped marginal cost curve. A perfectly competitive firm's supply curve is that portion of the marginal cost curve that lies above the minimum of the average variable cost curve. A perfectly competitive firm maximizes profit by producing the quantity of output that equates price and marginal cost. As such, the firm moves along the marginal cost curve in response to alternative prices.However, market control means that price is NOT equal to marginal revenue, and thus a monopolistically competitive firm does NOT equate marginal cost and price. For this reason, a monopolistically competitive firm does not move along its marginal cost curve. It does not necessarily supply larger quantities at higher prices or smaller quantities at lower prices. However, while market control means that a monopolistically competitive firm does not "technically" have a short-run supply curve based on its marginal cost curve, this is really a matter of degree. If market control is minimal and the demand curve is relatively elastic, the firm comes close to approximating the behavior of perfect competition. As such, a higher price is likely to induce an increase in the quantity supplied. This is not guaranteed, but very likely. Is there a chance that the higher price does NOT induce an increase in quantity supplied? Yes. Absolutely. With market control, that chance exists. But the chance is small. The odds are high that price and quantity supplied increase or decrease together as expected by the law of supply. (In)Efficiency| (In)Efficiency | 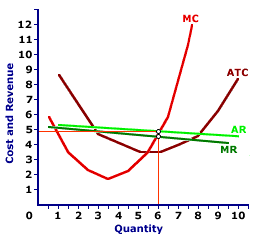 |
Because a monopolistically competitive firm charges a price that exceeds marginal cost, it does efficiently allocate resources. Price represents the value of goods produced and marginal cost represents the value of goods not produced. When both are equal, satisfaction cannot be increased by changing production.However, because price exceeds marginal cost, the economy gives up less satisfaction from other goods not produced than it receives from the good that is produced. The economy can gain satisfaction by producing more of the good. This exhibit once again displays the profit-maximizing production output of sandwiches by Manny Mustard. Manny Mustard produces the quantity of sandwiches (6) that equates marginal revenue and marginal cost. The resulting price charge is $4.95 per ounce. This price exceeds marginal cost, meaning Manny Mustard is inefficient. The price is higher and the quantity produced is less than what would be achieved with an efficient production. However, while Manny is "technically" inefficient, the inefficiency is relatively small compared to other market structures such as monopoly or oligopoly. Yes, the price Manny charges is higher and the quantity is less than what would be achieved through perfection competition. But the difference is small. To see how close Manny is to perfect competition, click of the [Efficient] button. This efficient production level occurs at the intersection of the marginal cost curve (MC) and the demand/average revenue curve (AR). The efficient price is just slightly less than the $4.95 Manny charges with monopolistic competition and the quantity produced is slightly more than his 6 sandwiches. In fact, the differences are so slight, they are hard to display in this exhibit. The bottom line is that monopolistic competition is inefficient. But if the firms have relatively little market control and face relatively elastic demand curves, the such inefficient is slight.

Recommended Citation:MONOPOLISTIC COMPETITION, SHORT-RUN PRODUCTION ANALYSIS, AmosWEB Encyclonomic WEB*pedia, http://www.AmosWEB.com, AmosWEB LLC, 2000-2025. [Accessed: July 18, 2025].
Check Out These Related Terms... | | | | | | | | | |
Or For A Little Background... | | | | | | | | |
And For Further Study... | | | |
Search Again?
Back to the WEB*pedia
|


|

|
|
There were no banks in colonial America before the U.S. Revolutionary War. Anyone seeking a loan did so from another individual.
|

|
|
"A winner is someone who recognizes his God-given talents, works his tail off to develop them into skills, and uses those skills to accomplish his goals. " -- Larry Bird, basketball player
|

|
AMEX
American Stock Exchange
|

|
|
Tell us what you think about AmosWEB. Like what you see? Have suggestions for improvements? Let us know. Click the User Feedback link.
User Feedback
|


|


