|
|
UNION: An organization of workers or employees who act jointly to negotiate with their employers over wages, fringe benefits, working conditions, and other facets of employment. The main function of unions is to provide a balance for the market control exerted over labor by big business.
Visit the GLOSS*arama
|
|


|

|
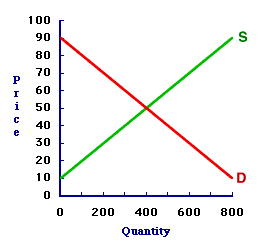
                           DISEQUILIBRIUM PRICE: A price that does not achieve equilibrium in the market. A disequilibrium price is either above or below the equilibrium price. A price below the equilibrium price creates a shortage and a price above the equilibrium price creates a surplus. In both case, the market imbalance prompts the price to change, moving toward the equilibrium price. A disequilibrium price is any price that does not achieve a balance between the market forces of demand and supply. More specifically, the quantity demanded is not equal to the quantity supplied. If quantity demanded exceeds quantity supplied, then a shortage exists. If quantity supplied exceeds quantity demanded, then a surplus exists.Out of Balance| The 8-Track Tape Market |  |
Disequilibrium prices that create surpluses and shortages can be illustrated using the market for 8-track tapes displayed in this exhibit. This graph was generated after long hours attending the 88th Annual Trackmania 8-Track Tape Collectors Convention at the Shady Valley Exposition Center.- 30 Cent: Consider first how a shortage is created at a 30 cent price. Click the [30 Cent] button to highlight this price. At 30 cents, the quantity demanded is 600 tapes and the quantity supplied is 200 tapes. This price does not generate equilibrium. The buyers want to buy 600 tapes, but only 200 tapes are offered for sale by the sellers. This shortage motivates buyers to offer a higher price.
- 70 Cent: Now consider how a surplus is created at a 70 cent price. Click the [70 Cent] button to highlight this price. At 70 cents, the quantity demanded is 200 tapes and the quantity supplied is 600 tapes. This price does not generate equilibrium, either. The sellers want to sell 600 tapes, but only 200 tapes are being purchased by the buyers. This surplus motivates sellers to charge a lower price.
For sake of completeness and for purposes of comparison, the equilibrium condition in the market can be identified by clicking the [Equilibrium] button. Doing so reveals an equilibrium price of 50 cents and an equilibrium quantity (without shortage or surplus) of 400 tapes.

Recommended Citation:DISEQUILIBRIUM PRICE, AmosWEB Encyclonomic WEB*pedia, http://www.AmosWEB.com, AmosWEB LLC, 2000-2025. [Accessed: July 1, 2025].
Check Out These Related Terms... | | | | | | | | | | | |
Or For A Little Background... | | | | | | | | | | | | | |
And For Further Study... | | | | | | | | | | |
Search Again?
Back to the WEB*pedia
|


|

|
PINK FADFLY
[What's This?]
Today, you are likely to spend a great deal of time calling an endless list of 800 numbers looking to buy either a battery-powered, rechargeable vacuum cleaner or a remote controlled World War I bi-plane. Be on the lookout for mail order catalogs with hidden messages.
Your Complete Scope
This isn't me! What am I?
|

|
|
A lump of pure gold the size of a matchbox can be flattened into a sheet the size of a tennis court!
|

|
|
"Experience keeps a dear school, but fools will learn in no other. " -- Benjamin Franklin
|

|
TC
Total Cost
|

|
|
Tell us what you think about AmosWEB. Like what you see? Have suggestions for improvements? Let us know. Click the User Feedback link.
User Feedback
|


|


