
|
|
REGULATORY PRICING: Government control over the price charge in a market, especially by a firm with market control. Price regulation is most commonly used for public utilities characterized as natural monopolies. If allowed to maximize profit without restraint, the price charged would exceed marginal cost and production would be inefficient. However, because such firms, as public utilities, produce output that is deemed essential or critical for the public, government steps in to regulate or control the price. The two most common methods of price regulation are marginal-cost pricing and average-cost pricing.
Visit the GLOSS*arama
|
|


|

|
                           SLOPE, PRODUCTION POSSIBILITIES CURVE: The numerical value of the slope of the production possibilities curve, which illustrates the alternative combinations of two goods that an economy can produce with given resources and technology, is the opportunity cost of producing the good measured on the horizontal axis. The slope of a production possibilities curve illustrates the tradeoff between the production of two goods. This tradeoff occurs due to limited resources. If all available resources are engaged production, then an increase in the production of one good requires a reduction in the production of the other good. This tradeoff reflects the fundamental concept of opportunity cost.Starting with SlopeThe slope of a line is measured by calculating the change in the value measured on the vertical axis divided by the change in the value measured on the horizontal axis. Another way of saying this is to divide the rise by the run.| Slope and the Curve | 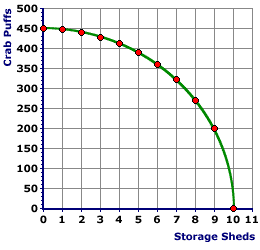 |
For a production possibilities curve that illustrates the production of crab puffs and storage sheds, this is the change in the quantity of crab puffs (rise) divided by the change in the quantity of storage sheds (run).Here is a handy formula for calculating the slope of the production possibilities curve. | slope | = | rise
run | = | change in crab puffs
change in sheds |
For example, the slope of the production possibilities curve between points I (8 sheds and 270 dozen crab puffs) and J (9 sheds and 200 dozen crab puffs). The slope between I and J is -70. The rise is a decrease of 70 and the run is an increase of 1. | slope, I to J | = | change in crab puffs
change in sheds | = | -70
1 | = | -70 |
Click the [Slope I to J] button to illustrate. For other slope values click the [Show The Rest] button. Now for Opportunity CostOpportunity cost is the highest valued alternative foregone in the pursuit of an activity. The opportunity cost of producing storage sheds is the foregone production of crab puffs. | The Schedule | 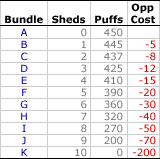 |
This production possibilities schedule can be used to illustrate opportunity cost.- The opportunity cost of producing the first shed is 5 dozen crab puffs.
- As the economy moves from bundle A to bundle B, the production of sheds increases from 0 to 1 and the production of crab puffs decreases from 450 dozen to 445 dozen.
- In order to produce the first shed, the economy must switch resources from crab puff production to shed production.
- As such, 5 dozen crab puffs are given up to produce the first shed.
Using a similar process, the opportunity cost of producing the second shed can be easily determined. (Hint: It is 8 dozen crab puffs, the difference between 445 dozen and 437 dozen.) These values are negative, which indicates the opportunity cost tradeoff between storage sheds and crab puffs.Increasing Opportunity Cost| Increasing Opportunity Cost | 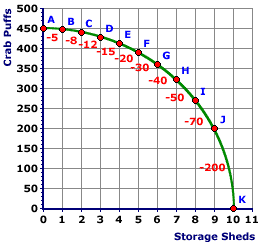 |
The slope of the production possibilities curve is the opportunity cost of the good measured on the horizontal axis, which in this example is storage sheds. The opportunity cost values for segments between each pair of points is presented on this production possibilities curve. The opportunity cost of producing the first shed, and the slope of the curve moving from point A to point B is 5 dozen crab puffs (or -5).Moving along the production possibilities curve, the slope becomes steeper (that is, the absolute value of the slope increases), reaching a value of -200 (an absolute value of 200) between points J and K. This reflects an increasing opportunity cost of producing storage sheds, resulting in a convex shape for the production possibilities curve. The reason for this convex shape rests with the law of increasing opportunity cost, one of the more important principles studied in economics. The law of increasing opportunity cost states that the opportunity cost of producing a good increases as more of the good is produced. - With relatively few sheds produced, the opportunity cost is low and the curve is flat. The production of the first shed, moving from point A to point B, uses resources best suited for shed production and least suited for crab puffs production. As such, very few puffs are given up to produce one shed.
- However, as more sheds are produced, the opportunity cost is higher and the curve is steeper. Resources removed from puff production are more suited for puff production and less suited for shed production.
- With production of the tenth shed, going from point J to point K, the resources switched are those least suited for storage sheds and best suited for crab puffs. As such, a relatively large number of puffs are given up to produce one shed.
- As more sheds are produced, the opportunity cost of production increases. The end result is a convex production possibilities curve.
Recommended Citation:SLOPE, PRODUCTION POSSIBILITIES CURVE, AmosWEB Encyclonomic WEB*pedia, http://www.AmosWEB.com, AmosWEB LLC, 2000-2025. [Accessed: July 16, 2025].
Check Out These Related Terms... | | | | | | | | | |
Or For A Little Background... | | | | | | | |
And For Further Study... | | | | | | | | | | | |
Search Again?
Back to the WEB*pedia
|

|

|
BLACK DISMALAPOD
[What's This?]
Today, you are likely to spend a great deal of time wandering around the shopping mall wanting to buy either 500 feet of coaxial cable or a coffee cup commemorating the 1960 Presidential election. Be on the lookout for spoiled cheese hiding under your bed hatching conspiracies against humanity.
Your Complete Scope
This isn't me! What am I?
|

|
|
One of the largest markets for gold in the United States is the manufacturing of class rings.
|

|
|
"The only thing that will stop you from fulfilling your dreams is you. " -- Tom Bradley, former Los Angeles mayor
|

|
UR
Unemployment Rate
|

|
|
Tell us what you think about AmosWEB. Like what you see? Have suggestions for improvements? Let us know. Click the User Feedback link.
User Feedback
|

|

