
|
|
COMMUNISM: In theory, an economy based on -- (1) a classless society, where everyone does their best to contribute to the common good, (2) a common, rather than individual, ownership of all resources, (3) the complete disappearance of government, and (4) income allocated based entirely on need rather than on resource ownership or contribution to production (that is, a needs standard, compare contributive standard).
Visit the GLOSS*arama
|
|


|

|
                           AVERAGE REVENUE PRODUCT CURVE: A curve that graphically illustrates the relation between average revenue product and the quantity of the variable input, holding all other inputs fixed. This curve indicates the per unit revenue at each level of the variable input. The average revenue product curve is one of two related curves often used in the analysis of factor demand. The other, and more important, is marginal revenue product curve. The average revenue product curve indicates how average revenue product is related to the quantity of a variable input used in production. While the analysis of factor markets tends to focus on labor as the variable input, a average revenue product curve can be constructed for any input.| Average Revenue Product Curve | 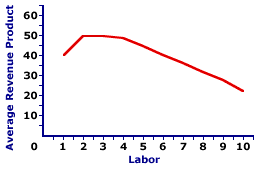 |
This diagram graphically represents the relation between average revenue product and the variable input. This particular curve is derived from the hourly production of Super Deluxe TexMex Gargantuan Tacos (with sour cream and jalapeno peppers) as Waldo's TexMex Taco World restaurant employs additional workers. The number of workers, measured on the horizontal axis, ranges from 0 to 10 and the average revenue product, measured on the vertical axis, ranges from $0 to $60.The shape of this average revenue product curve is most important. For the first two workers of variable input, average revenue product increases. This is reflected in a positive slope of the average revenue product curve. After the third worker, average revenue product declines. This is seen as a negative slope. While average revenue product continues to decline, it never reaches zero nor becomes negative. To do so requires total revenue to become zero and negative, which just does not happen. The hump-shape of the average revenue product curve is indirectly caused by increasing and decreasing marginal returns. The upward-sloping portion of the average revenue product curve, up to the second worker, is indirectly due to increasing marginal returns. The downward-sloping portion of the average revenue product curve, after the third worker, is indirectly due to decreasing marginal returns. and the law of diminishing marginal returns.
Recommended Citation:AVERAGE REVENUE PRODUCT CURVE, AmosWEB Encyclonomic WEB*pedia, http://www.AmosWEB.com, AmosWEB LLC, 2000-2025. [Accessed: July 18, 2025].
Check Out These Related Terms... | | | | | | | | |
Or For A Little Background... | | | | | | | | | | | | | |
And For Further Study... | | | | | | | | | |
Search Again?
Back to the WEB*pedia
|

|

|
RED AGGRESSERINE
[What's This?]
Today, you are likely to spend a great deal of time at a flea market wanting to buy either a weathervane with a cow on top or a box of multi-colored, plastic paper clips. Be on the lookout for telephone calls from long-lost relatives.
Your Complete Scope
This isn't me! What am I?
|

|
|
The Dow Jones family of stock market price indexes began with a simple average of 11 stock prices in 1884.
|

|
|
"A winner is someone who recognizes his God-given talents, works his tail off to develop them into skills, and uses those skills to accomplish his goals. " -- Larry Bird, basketball player
|

|
ME
Montreal Exchange
|

|
|
Tell us what you think about AmosWEB. Like what you see? Have suggestions for improvements? Let us know. Click the User Feedback link.
User Feedback
|

|

