
|
|
HOLDING COMPANY: A company (usually a corporation) that owns enough stock in another corporation to exercise virtually complete control over its management. Holding companies often own controlling interest in several diverse corporations, allowing it to engage in diverse activities (some of which might be risky) while limiting its liability should problems arise. While holding companies exist in most types of industries, then tend to be quite popular in banking. Through a holding company, a bank can essentially take part in other financial markets (selling insurance, underwriting securities, or acting as a broker) that are beyond the legal authority of the bank itself.
Visit the GLOSS*arama
|
|


|

|
                           FACTOR MARKET ANALYSIS: An analysis of the structure and equilibrium determination of markets that exchange the services of productive resources. This analysis highlights principles and concepts that tend to be most commonly associated with factor markets (also termed resource markets), including monopsony and bilateral monopoly. Marginal revenue product is a key concept on the demand side of the factor market. Marginal factor cost is a key concept on the supply side of the factor market. Factor markets are markets used to exchange and allocate the services of factor inputs and scarce resources among productive activities. The analysis of factor market activity highlights key concepts, especially the monopsony market structure--a market dominated by a single buyer.Factors of ProductionThe best place to begin an overview of factor market analysis is with the four factors of production--labor, capital, land, and entrepreneurship. This are the four inputs used in the production process. To produce output, activities must acquire the services of these factor inputs, which they do through factor markets.- Labor: Labor is the mental and physical efforts of humans (excluding entrepreneurial organization) used for the production of goods and services. Labor includes both the physical effort of factory workers and farmhands often associated with labor, as well as the mental effort of executives and supervisors.
- Capital: Capital is the manufactured, artificial, or synthetic goods used in the production of other goods, including machinery, equipment, tools, buildings, and vehicles. Capital is the produced factor of production. This factor must be produced using other factors of production, which means that society is often faced with the choice between producing consumption goods that satisfy wants and needs or capital goods that are used for future production.
Without capital, labor would do ALL production "by hand." The key role of capital in the production process is to make labor more productive. While a covey of construction workers might be able to fabricate a four-bedroom house with nothing but bare hands, an assortment of hammers, saws, and other tools is bound to make their work easier and more productive.
- Land: Land is the naturally occurring materials of the planet that are used for the production of goods and services, including the land itself; the minerals and nutrients in the ground; the water, wildlife, and vegetation on the surface; and the air above. The natural resources and materials of the land become the goods produced. Without these materials of the land, there is no production. Production is, in fact, the basic process of transforming naturally occurring materials that provide little satisfaction in their natural state, to goods and services that provide more satisfaction.
- Entrepreneurship: Entrepreneurship is the special sort of human effort that takes on the risk of bringing labor, capital, and land together to produce goods. Entrepreneurship is the factor that organizes the other three. Without someone to organize production, the other three factors do NOT produce. A key component of entrepreneurship is risk. This resource takes the risk of organizing production BEFORE anything is produced and with no guarantee that production will be successful.
Factor PaymentsComparable to most markets, factor markets exchange a commodity for a monetary payment or price. The general term for the monetary payments is factor payments. The specific factor payment depends on the specific factor exchanged. The factor payment of labor is wage, for capital is interest, for land is rent, and for entrepreneurship is profit. Such factor payments are what entice owners to allocate their resources for productive use. - Wage: This is a payment to the owner of labor in exchange for the productive service of labor. While wages are typically monetary payments, and result in paychecks, they invariably involve nonmonetary components, too. Common examples are employer contributions for health insurance, retirement programs, and other fringe benefits. Moreover, the psychological rewards provided by the job itself are important factor payments.
- Interest: This is a payment to the owner of capital in exchange for the productive services of capital. Interest payments are something of a round-about payment for capital services, based on the recognition that capital goods are generally purchased with borrowed funds. Such borrowing is profitable so long as the interest on the loan is matched by the productivity of the capital acquired.
- Rent: This is a payment to the owner of land in exchange for the productive services of land. Because land is a diverse resource category, so too is this notion of rent. It includes payments for the use of the land itself as well as the assorted resources extracted from the land.
- Profit: This is a payment to the owner of entrepreneurship in exchange for the productive services of entrepreneurship. Profit falls into one of two categories--normal profit, which is an opportunity cost based on the next best use of entrepreneurship, and economic profit, which is the excess of total revenue over total cost.
Behind the Demand SideFactor demand is the demand side of the factor market, capturing the relation between the factor price and the quantity demanded of a factor. In general, a lower price induces an increase in the quantity demanded, while a higher price has the opposite effect.The key to the factor demand relation between factor price and factor quantity is marginal revenue product',500,400)">marginal revenue product. Due to the law of diminishing marginal returns, marginal revenue product declines as the quantity of the factor employed increases. Because additional factor quantities generate less revenue, the buyer is inclined to pay a lower factor price. Hence, factor price declines with a larger factor quantity. | Factor Demand Curve | 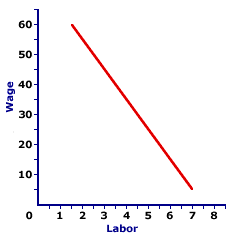 |
Factor demand is commonly represented by a factor demand curve, which graphically indicates the quantity of a factor that is demanded at alternative factor prices. The exhibit to the right displays a typical factor demand curve. This particular curve is the demand for labor. The number of workers is measured on the horizontal axis and the wage paid per worker is measured on the vertical axis. This factor demand curve indicates that employers are willing to hire 4 workers at $35 each, 5 workers at $25 each, and 6 workers at $15 each. The wage declines with an increase in the number of workers employed, because extra workers contribute less and less to total production and to total revenue. Behind the Supply SideFactor supply is the supply side of the factor market, capturing the relation between the factor price and the quantity supplied of a factor. In general, a higher price induces an increase in the quantity supplied, while a lower price has the opposite effect.Factor supply works much like the market supply of any good or service. Sellers, or factor owners, are enticed to offer a larger quantity for sale at a higher price. However, because the factors supplied are diverse (various types of labor, capital, land, and entrepreneurship), so too are the principles underlying supply. In fact, some factors are produced goods with supplies governed by the same production and cost principles governing market supply, especially the law of diminishing marginal returns. Other factor supplies involve human resources and are governed by other principles, especially consumer demand theory. | Factor Supply Curve | 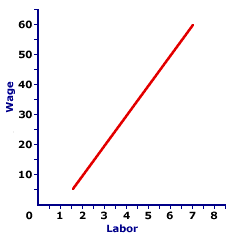 |
Factor supply is commonly represented by a factor supply curve, which graphically indicates the quantity of a factor that is supplied at alternative factor prices. The exhibit to the right displays a typical factor supply curve. This particular curve is the supply for labor in the greater Shady Valley metropolitan area. The number of workers (labor) is measured on the horizontal axis and the wage paid per worker is measured on the vertical axis. This factor supply curve indicates that a $10 wage entices 2 workers to supply their services, a $30 wage entices 4 workers to supply their services, and a $50 wage entices 6 workers to supply their services. The number of workers willing and able to supply their productive services increases with the wage.Notable Market StructuresFactor market analysis highlights two key market structures that are less prevalent in the analysis of product markets. The most noted market structure that surfaces in factor market is monopsony--a market dominated by a single buyer. This is the buying-side counterpart to monopoly--a market dominated by a single seller. The combination of monopsony and monopoly in the same market generates bilateral monopoly.- Monopsony: This is a market characterized by a single buyer of the product. A monopsony buyer is a price maker with complete control of the buying side of the market. Monopsony does not generate an efficient allocation of resources. The price paid by a monopsony is lower and the quantity exchanged is less than would be had by perfect competition.
- Bilateral Monopoly: This is a market containing a single buyer and a single seller. In effect, it is the combination of a monopoly market with a monopsony market. A market dominated by a profit-maximizing monopoly tends to charge a higher price. A market dominated by a profit-maximizing monopsony tends to pay a lower price. When combined into a bilateral monopoly, the buyer and seller are forced to negotiate a price. Then resulting price could be anywhere between the higher monopoly's price and the lower monopsony's price. Where the price ends up depends on the relative negotiating power of each side.
In addition to these two notable market structures, two other less common market structures also surface in factor market analysis. These are oligopsony and monopsonistic competition.- Oligopsony: This is a market characterized by a small number of relatively large competitors, each with substantial market control. Oligopsony represents the demand-side counterpart to oligopoly on the supply side. Oligopsony buyers, like their oligopoly counterparts, exhibit interdependent decision making which can lead to intense competition and the motivation to cooperate. Oligopsony tends to have serious inefficiency problems. Large firms that operate as oligopoly sellers of the output produced often act as oligopsony buyers of the inputs used.
- Monopsonistic Competition: This is a market characterized by a large number of relatively small competitors, each with a modest degree of market control on the demand side. Monopsonistic competition represents the demand-side counterpart to monopolistic competition on the supply side. A key feature of monopsonistic competition is product differentiation as each buyer seeks to purchase a slightly different product. While market control always means inefficiency, monopsonistic competition is not a serious offender. Monopsonistically competitive buyers are often on the other side of a market containing monopolistically competitive sellers.
Output Determination| Perfect Competition | 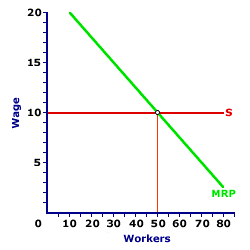 | Monopsony | 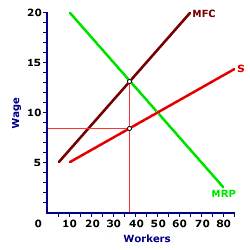 | Monopoly | 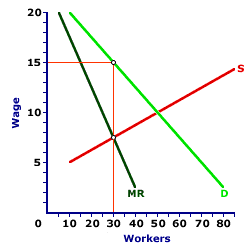 | Bilateral Monopoly | 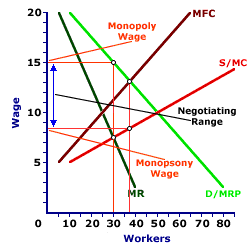 |
The primary purpose of factor market analysis is to understand and explain how factor markets undertake the exchange of factor services. Such analysis usually focuses on one of four models based on four market structures--perfect competition, monopsony, monopoly, and bilateral monopoly.The exhibit to the right can be used to illustrate each analysis. - Perfect Competition: The top panel presents the factor market situation for perfect competition. This perfectly competitive firm is one of a large number, with freedom of entry and exit and perfect knowledge. This means the firm is a price taker and can hire as many workers as it wants at the going wage.
As such, this firm faces a perfectly elastic, horizontal supply curve, represented by the red supply curve (S) that is horizontal at the going wage of $10. This wage is also the marginal factor cost incurred of hiring each extra worker. The second curve displayed in the exhibit is the green negatively-sloped marginal revenue product curve (MRP). This curve indicates the value of the extra production generated by each worker.
As a profit-maximizing firm, it hires the quantity that equates marginal factor cost and marginal revenue product, indicated by the intersection of the S and MRP curves. This is 50 workers. The wage paid each worker is the going market wage of $10.
- Monopsony: The second panel illustrates monopsony, a factor market dominated by a single buyer. As the only buyer, monopsony is a price maker. The supply curve that it faces for hiring labor is THE market supply curve.
This firm faces a positively-sloped supply curve, represented by the red supply curve (S). Because higher wages are needed to attract more labor, the positively-slope brown curve is the marginal factor cost curve (MFC). The third curve displayed in the exhibit is the green negatively-sloped marginal revenue product curve (MRP), which for sake of comparison is identical to that for perfect competition and also indicates the value of the extra production generated by each worker.
As a profit-maximizing firm, it also hires the quantity that equates marginal factor cost and marginal revenue product found at the intersection of the MFC and MRP curves. This quantity is 37 workers. The monopsony then pays each worker $8.40.
- Monopoly: The third panel illustrates monopoly, a factor market dominated by a single seller. As the only seller, monopoly is also a price maker. The demand curve that it faces for selling labor is THE market demand curve.
This firm faces a negatively-sloped demand curve, represented by the green demand curve (D). Because lower wages are needed to sell more labor, the negatively-sloped dark green curve is the marginal revenue curve (MR). The third curve displayed in the exhibit is the red positively-sloped supply curve (S), which also represents the marginal cost incurred by the monopoly.
As a profit-maximizing firm, it also hires the quantity that equates marginal cost and marginal revenue found at the intersection of the S and MR curves. This quantity is 30 workers. The monopoly then charges $15 for each worker employed.
- Bilateral Monopoly: The bottom panel illustrates bilateral monopoly, a factor market containing a single buyer and a single seller. The market control of the seller is more or less offset by the market control of the seller. With this market structure a clear-cut equilibrium price and quantity is not indicated.
This market is the combination of the second and third panels. From the monopsony side, the buyer faces the red supply curve (S) and the brown marginal factor cost curve (MFC). From the monopoly side, the seller the green demand curve (D) and the dark green marginal revenue curve (MR).
The negotiated wage falls somewhere between the $8.40 monopsony wage and the $15 monopoly wage. The negotiated quantity ends up somewhere between the 30 monopoly quantity and the 37 monopsony quantity. Where these values end up depends on the negotiating skill and power of each side.

Recommended Citation:FACTOR MARKET ANALYSIS, AmosWEB Encyclonomic WEB*pedia, http://www.AmosWEB.com, AmosWEB LLC, 2000-2025. [Accessed: July 18, 2025].
Check Out These Related Terms... | | | | | |
Or For A Little Background... | | | | | | | | |
And For Further Study... | | | | | | | |
Search Again?
Back to the WEB*pedia
|


|

|
GRAY SKITTERY
[What's This?]
Today, you are likely to spend a great deal of time driving to a factory outlet wanting to buy either a coffee cup commemorating yesterday or a replacement remote control for your television. Be on the lookout for a thesaurus filled with typos.
Your Complete Scope
This isn't me! What am I?
|

|
|
In his older years, Andrew Carnegie seldom carried money because he was offended by its sight and touch.
|

|
|
"A winner is someone who recognizes his God-given talents, works his tail off to develop them into skills, and uses those skills to accomplish his goals. " -- Larry Bird, basketball player
|

|
NBER
National Bureau of Economic Research
|

|
|
Tell us what you think about AmosWEB. Like what you see? Have suggestions for improvements? Let us know. Click the User Feedback link.
User Feedback
|


|


