|
|
IMPLICIT PRICE DEFLATOR: A price index calculated as the ratio nominal gross domestic product to real gross domestic product. Also commonly referred to as the GDP price deflator, the implicit price deflator is used as an indicator of the economy's average price level. This price index is tabulated and reported every three months along with the gross domestic product, national income, and related measures that make up the National Income and Product Accounts maintained by the Bureau of Economic Analysis (BEA).
Visit the GLOSS*arama
|
|


|

|
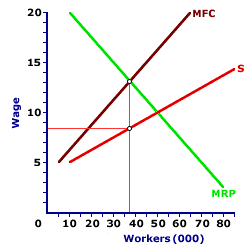
                           MONOPSONY, EFFICIENCY: A monopsony firm generally purchases less output and pays a lower price than would be the case for perfect competition. In particular, the factor price charged by a monopsony is less than the marginal revenue product. The key source of this inefficiency is market control, which means monopsony faces a positively-sloped supply curve and factor price is less than marginal factor cost. Monopsony is a market in which a single buyer completely controls the demand for a good. While the market for any type of good, service, resource, or commodity could, in principle, function as monopsony, this form of market structure tends to be most pronounced for the exchange of factor services. Because it is the only buyer in the market, the supply curve it faces is the positively-sloped market supply curve. Any seller that seeks to sell, must sell to the monopsony.Like any firm with market control, monopsony does not efficiently allocate resources. It violates the standard factor market efficiency criterion that factor price equal marginal revenue product. At the profit-maximizing quantity purchased by a monopsony, factor price is less than marginal revenue product. The reason for monopsony inefficiency is found with market control. Because the monopsony firm IS the market, the market supply curve is THE supply curve for the monopsony's purchases. Because the supply curve is positively sloped, factor price is less than marginal factor cost. And because a profit maximizing firm equates marginal revenue product with marginal factor cost, the factor price paid by monopsony when it maximizes profit is less than marginal revenue product. Profit Maximization| Inefficiency |  |
To illustrate the inefficiency of monopsony consider the Natural Ned Lumber Company, a hypothetical lumbering operation in the isolated Jagged Mountains region north of the greater Shady Valley metropolitan area. The Natural Ned Lumber Company is the only employer of labor located in nearby Lumber Town. This makes the Natural Ned Lumber Company a monopsony employer and a price maker when it comes to buying labor services from Lumber Town.A typical profit-maximizing input hiring decision using the marginal revenue product and marginal factor cost is presented in this diagram. The three curves presented are the marginal revenue product curve (MRP), the market supply curve (S), and the corresponding marginal factor cost curve (MFC) for the monopsony. A profit-maximizing monopsony produces the quantity of output that equates marginal revenue product with marginal factor cost, then pays the price sellers are willing and able to accept for that quantity. Natural Ned maximizes profit by hiring the number of workers that equates marginal revenue product and marginal factor cost, which is 37,000 workers in this example. The corresponding price paid is $8.40. This profit-maximizing level of employment is not efficient. In particular, the factor price is $8.40, but the marginal revenue product is $13. Society is using labor to produce and consume a good that it values at $13 (marginal revenue product). However, in so doing, society is using resources that could have produced other goods valued at $8.40 (marginal factor cost). Society gives up $8.40 worth of value and receives $13. This is a good thing. It is so good, that society should do more. However, the monopsony is not letting this happen. Natural Ned is not hiring as many labor resources that can be devoted to production as society would like. An Efficient AlternativeThe degree of monopsony inefficiency can be illustrated with a comparison to perfect competition. Such a comparison is easily accomplished by clicking the [Perfect Competition] button. A primary use of perfect competition is to provide a benchmark for the comparison with other market structures, such as monopsony.A comparison between monopsony and perfect competition indicates: - Monopsony hires less input than perfect competition. In this example, the monopsony hires 37,000 workers compared to about 50,000 workers for perfect competition. The Natural Ned monopsony does not allocate enough resources to the production of lumber.
- Monopsony pays a lower price than perfect competition. In this example, the monopsony price is $8.40 per worker versus about $10 worker for perfect competition. The Natural Ned monopsony is NOT efficient because it hires a quantity in which factor price is less than marginal revenue product.

Recommended Citation:MONOPSONY, EFFICIENCY, AmosWEB Encyclonomic WEB*pedia, http://www.AmosWEB.com, AmosWEB LLC, 2000-2025. [Accessed: July 18, 2025].
Check Out These Related Terms... | | | | |
Or For A Little Background... | | | | | | | | | |
And For Further Study... | | | | | | | |
Search Again?
Back to the WEB*pedia
|


|

|
YELLOW CHIPPEROON
[What's This?]
Today, you are likely to spend a great deal of time searching the newspaper want ads trying to buy either a T-shirt commemorating the 2000 Olympics or a genuine fake plastic Tiffany lamp. Be on the lookout for telephone calls from former employers.
Your Complete Scope
This isn't me! What am I?
|

|
|
A scripophilist is one who collects rare stock and bond certificates, usually from extinct companies.
|

|
|
"A winner is someone who recognizes his God-given talents, works his tail off to develop them into skills, and uses those skills to accomplish his goals. " -- Larry Bird, basketball player
|

|
ARP
Average Revenue Product
|

|
|
Tell us what you think about AmosWEB. Like what you see? Have suggestions for improvements? Let us know. Click the User Feedback link.
User Feedback
|


|


