Bilateral monopoly is a market characterized by a single firm selling a product and a single firm buying the product. Bilateral monopoly is what results when a monopoly market is combined with a monopsony market. While any type of market, in principle, can be a bilateral monopoly, factor markets tend to offer the best examples and thus are where the analysis is generally directed.A Tree Chopping Market
An example that can be used to illustrate a bilateral monopoly factor market begins with the Natural Ned Lumber Company. This is a hypothetical lumbering operation in the isolated Jagged Mountains region north of the greater Shady Valley metropolitan area. The Natural Ned Lumber Company is an expansive operation employing thousands of workers, all of whom reside in Lumber Town, which is adjacent to the Natural Ned Lumber Company lumbering operations. In fact, everyone living in Lumber Town works for the Natural Ned Lumber Company.This makes the Natural Ned Lumber Company a monopsony employer. If anyone in Lumber Town seeks employment, then they must seek it with the Natural Ned Lumber Company. This makes the Natural Ned Lumber Company a price maker when it comes to buying labor services. The Natural Ned Lumber Company can determine the quantity of labor services desired, then charge the minimum factor price that workers are willing and able to receive.
However, the employees of the Natural Ned Lumber Company, after succumbing to low monopsony wages for years, have formed a labor union, the United Tree Choppers Union. The United Tree Choppers Union speaks for ALL of the Natural Ned Lumber Company employees, essentially controlling the supply-side of this particular labor market. This makes the United Tree Choppers Union a monopoly seller. And as a monopoly seller, United Tree Choppers Union seeks to maximize its "profit," which is effectively the total income paid the workers.
The best way to understand a bilateral monopoly, is a review of how each side of the market operates without the other.
The Natural Ned Lumber Company Monopsony
| Ned's Lumber Monopsony |  |
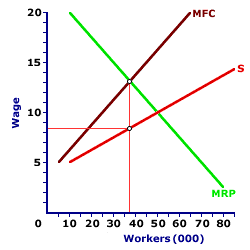
The first step is to examine how a monopsony like the Natural Ned Lumber Company sets the profit-maximizing price and quantity, WITHOUT a monopoly controlling the other side of the market. This exhibit displays the market for labor services in Lumber Town when controlled on the buying side by the Natural Ned Lumber Company. The vertical axis measures the factor price (wage rate) and the horizontal axis measures the quantity of labor services (number of workers).The key for any monopsony buyer like the Natural Ned Lumber Company, is that the supply curve it faces for hiring labor is THE market supply curve for the factor. This is the positively-sloped factor supply curve, labeled S in this diagram. Accompanying the factor supply curve is a positively-sloped marginal factor cost curve, labeled MFC. It lies above the factor supply curve.
The third curve, labeled MRP, is the marginal revenue product curve for the Natural Ned Lumber Company. This curve is the additional revenue that the Natural Ned Lumber Company receives as a result of hiring each additional worker. It is based on the marginal physical product of the workers and the price of the lumber produced.
As a profit-maximizing entity, the Natural Ned Lumber Company hires labor services up to the point in which marginal factor cost is equal to marginal revenue product. This profit-maximizing quantity of labor is 37,000 workers and the wage the Natural Ned Lumber Company pays each worker is $8.40 per hour.
The United Tree Choppers Union Monopoly
| Tree Choppers Monopoly |  |
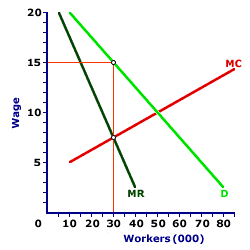
The next step is to examine how a monopoly like the United Tree Choppers Union sets the profit-maximizing price and quantity, WITHOUT a monopsony controlling the other side of the market. This exhibit displays the market for labor services in Lumber Town when controlled on the selling side by the United Tree Choppers Union. The vertical axis measures the factor price (wage rate) and the horizontal axis measures the quantity of labor services (number of workers).The key for any monopoly seller like the United Tree Choppers Union, is that the demand curve it faces for selling labor is THE market demand curve for the factor. This is the negatively-sloped factor demand curve, labeled D in this diagram. Accompanying the factor demand curve is a negatively-sloped marginal revenue curve, labeled MR. It lies below the factor demand curve.
The third curve, labeled MC, is the United Tree Choppers Union's marginal cost curve. This curve is the additional cost the Tree Choppers incur for each additional worker offered for "sale." It is based on the opportunity cost of foregone activities.
As a profit-maximizing entity, the United Tree Choppers Union provides labor services up to the point in which marginal cost is equal to marginal revenue. This profit-maximizing quantity of labor is 30,000 workers and the United Tree Choppers Union and charges employers a wage of $15 per hour.
The Bilateral Monopoly
| Bilateral Lumber Monopoly |  |
A bilateral monopoly emerges by combining the Natural Ned Lumber Company monopsony with the United Tree Choppers Union monopoly. Because the profit-maximizing price charged by the United Tree Choppers Union monopoly ($15) is higher than the profit-maximizing price paid by the Natural Ned Lumber Company monopsony ($8.50), both sides cannot maximize profit. The price ultimately achieved in this market depends on the relatively negotiating power of each side. This exhibit summarizes the bilateral monopoly for the employment of tree choppers. A word or two about the four main curves in the exhibit is needed.
- Marginal Revenue Product and Demand: The first of the two negatively-sloped curves (D/MRP) is the marginal revenue product curve for employment by the Natural Ned Lumber Company monopsony, the MRP part. This curve, however, is also the demand curve for labor services facing the United Tree Choppers Union monopoly, the D part.
- Marginal Revenue: The second negatively-sloped curve (MR) is the marginal revenue curve when the D/MRP curve is viewed as the demand curve facing for the United Tree Choppers Union monopoly. This marginal revenue curve indicates how much additional revenue the monopoly union generates when an extra worker is employed.
Before moving on to the other two curves, make certain the distinction between these two marginal revenue curves is clear. The MRP curve is based on the revenue received by the Natural Ned Lumber Company when it hires labor to produce lumber. When it is viewed as the demand curve for labor services, it is also the average revenue curve for the United Tree Choppers Union monopoly. And like any demand curve that is also an average revenue curve, it has a corresponding marginal revenue curve, which is the second curve, labeled MR. The MR curve thus represents the additional revenue received by the United Tree Choppers Union for selling additional units of its "output," which is labor services.
- Marginal Cost and Supply: The first of two positively-sloped curves (S/MC) is the marginal cost curve, which is the marginal cost incurred by the United Tree Choppers Union for selling labor services, the S part. This curve is also the supply curve for labor services facing the Natural Ned Lumber Company monopsony employer, the MC part.
- Marginal Factor Cost: The second positively-sloped curve (MFC) is the marginal factor cost curve when the S/MC curve is viewed as the supply curve facing the Natural Ned Lumber Company monopsony. This marginal factor cost curve indicates how much additional cost the monopsony incurs when an extra worker is employed.
The distinction between these two marginal cost curves is similar to the distinction between the two marginal revenue curves. The MC curve is based on the cost incurred by the United Tree Choppers Union when selling labor to the lumber company.When it is viewed as the supply curve for labor services, it is also the average factor cost curve for the Natural Ned Lumber Company monopsony buying the labor. And like any supply curve that is also an average factor cost curve, it has a corresponding marginal factor cost curve, which is the second curve, labeled MFC. The MFC curve thus represents the additional cost incurred by the monopsony resort for buying additional units of labor services.
One on One Negotiation
As might be expected, the wage paid by the monopsony buyer is less than the wage charged by the monopoly seller. And while this particular example generates greater employment by the monopsony (37,000) than by the monopoly (30,000), this need not happen. It could go either way.The key conclusion of a bilateral monopoly is that a single, profit-maximizing price and quantity cannot be identified. There is NO price and quantity that simultaneously maximizes the profit of the monopsony and the monopoly, thus satisfying both sides of this market.
What results with a bilateral monopoly is the need for negotiation between the monopoly and the monopsony. The Natural Ned Lumber Company monopsony wants to pay workers a wage of $8.40 per hour. The United Tree Choppers Union monopoly wants workers to receive a wage of $15 per hour. The two sides need to negotiate a price. But what price?
Unlike other output analyses, there is no way of knowing the price. It could be $8.40, it could be $15, or it could be anywhere between. While a specific price cannot be pinpointed, a few general tendencies can be noted.
- First, the price must lie between the $8.40 monopsony price and the $15 monopoly price. The monopsony buyer will not pay more than the $15 monopoly price and monopoly sellers will not accept less than the $8.40 monopsony price.
- Second, the price depends on which side has relatively greater negotiating power. If the monopoly seller is relatively more powerful than the monopsony buyer, then the price tends to be closer to the $15 monopoly price. However, if the monopsony buyer is relatively more powerful than the monopoly seller, then the price tends to be closer to the $8.40 monopsony price.
- Third, while a monopoly controlled market, by itself, is inefficient, and a monopsony controlled market, by itself, is inefficient, a bilateral monopoly is not necessarily such a bad thing. A monopoly price is definitely higher than the price derived by perfect competition. A monopsony price is definitely lower than that derived by perfect competition. However, should the monopoly control of supply balance out the monopsony control of demand, then the resulting price "could" be close to, or even the same as, the perfectly competitive price. While bilateral monopoly is not necessarily efficient, it is likely to be less inefficient that monopsony and monopoly alone. It is sort of the case of "two wrongs making a right."
This third point actually points to the historical development of the bilateral monopoly form of market structure. In the early days of the U.S. industrial revolution, the late 1800s and early 1900s, large industrial activities (factories, mines, lumber operations) were prone to create monopsonies by dominating the labor market of a given community. The expected monopsony outcome, especially low wages, inevitably resulted.Reacting to these less than desirable situations, workers formed labor unions with the expressed goal of monopolizing the selling side of the markets AND balancing the monopsony power of the employers. These factor markets then became bilateral monopolies.
BILATERAL MONOPOLY, FACTOR MARKET ANALYSIS, AmosWEB Encyclonomic WEB*pedia, http://www.AmosWEB.com, AmosWEB LLC, 2000-2025. [Accessed: July 18, 2025].


