|
|
LEAKAGE LINE: A line used in the injection-leakage model representing the relation between non-consumption uses of income (that is, leakages) and national income. The three leakages are saving, taxes, and imports. The foundation of the leakages line is the saving line, which is then enhanced by adding taxes and imports. The other part of the injection-leakage model is a line representing injections. The intersection of the injection and leakage lines identifies equilibrium aggregate output, or Keynesian equilibrium.
Visit the GLOSS*arama
|
|


|

|
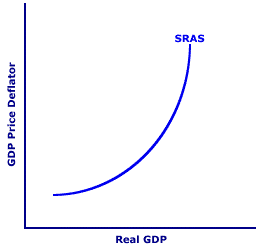
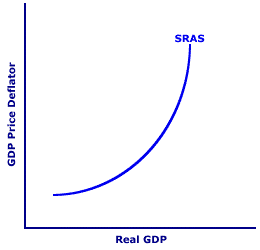
                           SHORT-RUN AGGREGATE SUPPLY CURVE: A graphical representation of the short-run relation between real production and the price level, holding all ceteris paribus aggregate supply determinants constant. The short-run aggregate supply, or SRAS, curve is one of two curves that graphical capture the supply-side of the aggregate market. The other is the long-run aggregate supply curve (LRAS). The demand-side of the aggregate market is occupied by the aggregate demand curve. The positive slope of the SRAS curve captures the direct relation between real production and the price level that exists in the short run. The short-run aggregate supply curve captures the relation between real production and the price level. As the price level rises, real production is greater. As the price level falls, real production also declines. The interaction between the short-run aggregate supply curve and the aggregate demand curve, as well as the long-run aggregate supply curve is the core mechanism of the aggregate market (AS-AD) analysis. This analysis is then used to explain and understand macroeconomic phenomenon, including business cycles, inflation, unemployment, and stabilization policies.The Short-Run Aggregate Supply Curve| The Short-Run Curve |  |
A typical short-run aggregate supply curve, labeled SRAS, is presented in this graph. Consider a few highlights.- First, note that the price level is measured on the vertical axis and real production is measured on the horizontal axis. The price level is usually measured by the GDP price deflator and real production is measured by real GDP.
- Second, note that the short-run aggregate supply curve, labeled SRAS, has a positive slope. Aggregate real production that the business sector offers for sale is greater at higher price levels and less at lower price levels.
- Third, the price level and aggregate real production are the only two variables allowed to change in the construction of this curve. Everything else that could affect short-run aggregate supply is assumed to remain constant. Analogous to market supply, these other variables are ceteris paribus factors that fall under the heading of aggregate supply determinants.
- Fourth, this short-run aggregate supply curve captures the relation between the price level and the flow of real production over a given time period, usually one year. However, depending on the particular aggregate market (AS-AD) analysis, the time period could be shorter (one month or one quarter) or longer (year or more). Of course, if the time period is too long, then a short-run aggregate supply curve is not likely to be relevant.
Moving Along the SRAS Curve| Along the Curve |  |
The positive slope of the short-run aggregate supply curve captures the direct relation between the price level and real production. A higher price level is related to an increase in real production and a lower price level is related to a decrease in real production. Moreover, changes in the price level are the direct cause of changes in real production, which is reflected by a movement along the short-run aggregate supply. To illustrate this, click the [Change Price Level] button.Movement along the short-run aggregate curve can be achieved for three reasons: - Real Wage Misperception: Workers and other resource suppliers might be temporarily fooled into thinking the purchasing power of their wages and prices has increased. This occurs because workers have close, personal knowledge of their wages when they cash their paychecks, but they are likely to have less information about the price level. Because they THINK their real wages and prices are greater they increase the quantities of their resources supplied. In other words, people work harder when they get paid more. And when they work harder, firms produce more.
- Price and Wage Adjustment: The purchasing power of the wages and resource prices received by workers and other resource suppliers might actually increase temporarily. This results because wages and prices do not all increase at the same pace. For example, wages might increase NOW, while the price level increases LATER. Because resource suppliers are actually receiving greater real wages and prices NOW, they increase the quantities of their resources supplied. Once again, people work harder when they get paid more. And when they work harder, firms produce more.
- Frictional and Structural Unemployment: Even at full employment some resources, especially labor, remain frictionally and structurally unemployed. These resources represent a "pool" that can be enticed into production activities... under the right conditions. For frictionally unemployed resources, it means generating the information needed to match up available resources with available production activities. For structurally unemployed resources, it means retraining workers or otherwise reconfiguring the resources to match what the production activities need. Doing so, however, incurs a cost.
For all three reasons, a higher price level increases real production and a lower price level decreases real production.In the aggregate market analysis, the price level generally changes in response to a disequilibrium in the economy. The change in the price level then leads to changes in real production and a movement along the short-run aggregate supply curve, which is the mechanism that restores equilibrium. The key is that price level changes CAUSE movements along the short-run aggregate supply curve. Shifting the SRAS Curve| Shifting the Curve |  |
The short-run aggregate supply curve is constructed assuming all aggregate supply determinants remain unchanged. Should any of these determinants change, the short-run aggregate supply curve shifts to a new position. The short-run aggregate supply curve can either shift rightward (an increase in aggregate supply) or leftward (a decrease in aggregate supply). Click the [Increase in SRAS] and [Decrease in SRAS] buttons to illustrate.Shifts of the short-run aggregate supply curve can be brought about by such things as technology, changes in wages and other resource prices, or changes in resource quantities. While changes in aggregate supply determinants and resulting shifts of the short-run aggregate supply curve are less dramatic than changes affecting aggregate demand, they DO change. In most cases the changes are slow and steady, for example, the natural growth of the population. From time to time, however, shifts in the short-run aggregate supply curve are more abrupt, such as higher energy prices during the 1970s. Perhaps most important, shifts in the short-run aggregate supply are the mechanism that automatically moves the aggregate market from short-run equilibrium to long-run equilibrium. The short-run aggregate supply curve is shifted due to changes by any (ceteris paribus) factor other than the price level. Three broad determinant categories include: - Resource Quantity: This determinant is the quantity of the resources--labor, capital, land, and entrepreneurship--that the economy has available for production. If the economy has more resources, then aggregate supply increases and the short-run aggregate supply curve shifts rightward. With fewer resources, aggregate supply decreases and the short-run aggregate supply curve shifts leftward. Specific determinants in this category include population growth, labor force participation, capital investment, and exploration.
- Resource Quality: This determinant is the quality of resources, especially technology and education. If the quality of labor, capital, land, and entrepreneurship change, then aggregate supply changes and the short-run aggregate supply curve shifts. An improved quality increases aggregate supply, triggering a rightward shift of the short-run aggregate supply curve, and a decline in quality decreases aggregate supply, generating a leftward shift of the short-run aggregate supply curve.
- Resource Price: This determinant is the price of any of resource input used in production, especially wages and energy prices. Resource prices affect the cost of producing output and thus the price level charged for an existing quantity of real production. This determinant ONLY affects the short-run aggregate supply. Because the long-run aggregate supply is independent of the price level it is also unaffected by changes in resource prices and production cost.
Full Employment| Short Run and Full Employment |  |
Before leaving short-run aggregate supply curve, one last item needs to be identified--full-employment production. A key point about the short run is that production can be either greater or less than full-employment production. If the economy is operating on the short-run aggregate supply curve at a level that is greater than full-employment production, then inflation tends to be a problem. If the economy is operating on the short-run aggregate supply curve at a level that is less than full-employment production, then unemployment tends to be a problem.To see where full-employment production resides relative to this particular short-run aggregate supply curve, click the [Full Employment] button. This level of full-employment production, by the way, just happens to correspond with the location of the long-run aggregate supply curve.

Recommended Citation:SHORT-RUN AGGREGATE SUPPLY CURVE, AmosWEB Encyclonomic WEB*pedia, http://www.AmosWEB.com, AmosWEB LLC, 2000-2025. [Accessed: July 18, 2025].
Check Out These Related Terms... | | | | | | | | | |
Or For A Little Background... | | | | | | | | |
And For Further Study... | | | | | | | | | | |
Search Again?
Back to the WEB*pedia
|


|

|
RED AGGRESSERINE
[What's This?]
Today, you are likely to spend a great deal of time at a flea market wanting to buy either a weathervane with a cow on top or a box of multi-colored, plastic paper clips. Be on the lookout for telephone calls from long-lost relatives.
Your Complete Scope
This isn't me! What am I?
|

|
|
The portion of aggregate output U.S. citizens pay in taxes (30%) is less than the other six leading industrialized nations -- Britain, Canada, France, Germany, Italy, or Japan.
|

|
|
"A winner is someone who recognizes his God-given talents, works his tail off to develop them into skills, and uses those skills to accomplish his goals. " -- Larry Bird, basketball player
|

|
WLLN
Weak Law of Large Numbers
|

|
|
Tell us what you think about AmosWEB. Like what you see? Have suggestions for improvements? Let us know. Click the User Feedback link.
User Feedback
|


|


