|
|
EUROPEAN COMMISSION: The executive body of the European Union that is charged with initiating Union-wide regulations. This is as close as the European Union has come to a centralized "federal" government comparable to that in the United States. It, however, has not achieved the status. The 15 national members of the European Union still retain a significant degree of autonomy.
Visit the GLOSS*arama
|
|


|

|
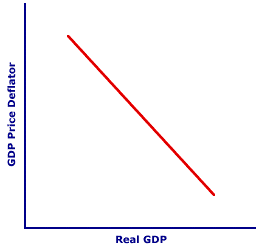
                           AGGREGATE DEMAND CURVE: A graphical representation of the relation between aggregate expenditures on real production and the price level, holding all ceteris paribus aggregate demand determinants constant. The aggregate demand (AD) curve is one side of the graphical presentation of the aggregate market. The other side is occupied by the long-run aggregate supply curve and/or the short-run aggregate supply curve. The negative slope of the aggregate demand curve captures the inverse relation between aggregate expenditures on real production and the price level. This negative slope is attributable to the interest-rate, real-balance, and net-export effects. The aggregate demand curve captures the relation between aggregate expenditures and the price level. As the price level rises, aggregate expenditures fall. As the price level falls, aggregate expenditures rise. The interaction between the aggregate demand curve and the long-run aggregate supply curve and/or the short-run aggregate supply curve is the core mechanism of the AS-AD analysis. This analysis is then used to explain and understand macroeconomic phenomenon, including business cycles, inflation, unemployment, and stabilization policies.The Aggregate Demand Curve| Aggregate Demand Curve |  |
A typical aggregate demand curve is presented in the exhibit to the right. Consider a few highlights of this curve.- First, the price level is measured on the vertical axis and real production (or more specifically aggregate expenditures on real production) is measured on the horizontal axis. The price level is measured by the GDP price deflator and real production is measured by real GDP.
- Second, this aggregate demand curve has a negative slope. The aggregate expenditures that the four sectors of the economy make at higher price levels are relatively low. However, at lower price levels, aggregate expenditures are greater.
- Third, the price level and aggregate expenditures on real production are the only two variables allowed to change in the construction of this curve. Everything else that could affect aggregate demand is assumed to remain constant. Analogous to market demand, these other variables are ceteris paribus factors that fall under the heading of aggregate demand determinants.
- Fourth, this aggregate demand curve captures the relation between the price level and real production during a given time period, usually one year. However, depending on the particular aggregate market analysis, the time period could be shorter (one month or one quarter) or longer (several years).
Moving Along the Aggregate Demand Curve| Along the Curve | 
|
The negative slope of the aggregate demand curve captures the inverse relation between the price level and aggregate expenditures on real production. A higher price level is related to fewer aggregate expenditures and a lower price level is related to greater aggregate expenditures. Moreover, changes in the price level are the direct cause of changes in aggregate expenditures, which is reflected by a movement along the aggregate demand curve. To illustrate this, click the [Change Price Level] button.Movement along the aggregate demand curve is attributable to three key effects: - Real-Balance Effect: This occurs when a change in the price level changes aggregate expenditures on real production due to a change in purchasing power of money. In other words, members of the household, business, government, and foreign sectors simply cannot buy as much production with the quantity of money available.
- Interest-Rate Effect: This is a change in investment expenditures or consumption expenditures triggered by a change in the interest rate that is itself triggered by a change in the price level.
- Net-Export Effect: This is a change in net exports, and thus aggregate expenditures, that results because a change in the price level alters the relative prices of exports and imports.
With all three effects, a higher price level reduces aggregate expenditures and a lower price level increases aggregate expenditures.In the analysis of the aggregate market, the price level generally changes in response to a disequilibrium in the economy. The change in the price level then leads to changes in aggregate expenditures and a movement along the aggregate demand curve, which is the mechanism that restores equilibrium. The key is that price level changes CAUSE movements along the aggregate demand curve. Shifting the Aggregate Demand Curve| Shifting the Curve | 
|
The aggregate demand curve is constructed assuming all aggregate demand determinants remain unchanged. Should any of these determinants change, the aggregate demand curve shifts to a new position. The aggregate demand curve can either shift rightward (an increase in aggregate demand) or leftward (a decrease in aggregate demand). Click the [Increase in AD] and [Decrease in AD] buttons to illustrate.Shifts of the aggregate demand curve, brought about by such things as fiscal or monetary policies, changes in investment expenditures, or changes in consumer confidence, are often the source of disequilibrium in the aggregate market. Such disequilibrium then cause changes in the price level. The key is that aggregate demand determinants CAUSE shifts of the aggregate demand curve which CAUSE disequilibrium which then CAUSES changes in the price level. The aggregate demand curve is shifted due to changes by any (ceteris paribus) factor other than the price level. A short list includes: - Interest Rate: This determinant includes any change in the interest rate, other than that triggered by a change in the price level, which then causes changes in investment expenditures and consumption expenditures. Higher interest rates reduce expenditures and lower interest rates increase expenditures.
- Inflationary Expectations: This determinant results if consumers expect a different inflation rate in the near future, which then causes a change in current consumption expenditures. Expectations of greater inflation increase expenditures and expectations of less inflation decreases expenditures.
- Money Supply: This determinant is based on a change in the money supply, which then induces changes in expenditures by all four sectors. If the money supply increases, then expenditures rise, if the money supply decreases, then expenditures fall.
- Consumer Confidence: This determinant results when the confidence consumers have concerning the state of the economy changes. If consumers are optimistic about the state of the economy, then they are likely to increase expenditures. If consumers are pessimistic about the state of the economy, then they are likely to decrease expenditures.

Recommended Citation:AGGREGATE DEMAND CURVE, AmosWEB Encyclonomic WEB*pedia, http://www.AmosWEB.com, AmosWEB LLC, 2000-2025. [Accessed: July 2, 2025].
Check Out These Related Terms... | | | | | | | |
Or For A Little Background... | | | | | | | | | | | | | | |
And For Further Study... | | | | | | | | | | | | |
Search Again?
Back to the WEB*pedia
|


|

|
RED AGGRESSERINE
[What's This?]
Today, you are likely to spend a great deal of time driving to a factory outlet hoping to buy either a pair of handcrafted oven mitts or a coffee table shaped like the state of Florida. Be on the lookout for crowded shopping malls.
Your Complete Scope
This isn't me! What am I?
|

|
|
The first U.S. fire insurance company was established by Benjamin Franklin in 1752 in Philadelphia.
|

|
|
"always remember an epitaph which is in the cemetery at Tombstone, Arizona. It says: „Here lies Jack Williams. He done his damnedest.¾ I think that is the greatest epitaph a man can have ‚ When he gives everything that is in him to do the job he has before him. That is all you can ask of him and that is what I have tried to do. " -- Harry Truman, 33rd US president
|

|
VC
Variable Cost
|

|
|
Tell us what you think about AmosWEB. Like what you see? Have suggestions for improvements? Let us know. Click the User Feedback link.
User Feedback
|


|


