
|
|
ENVIRONMENT: All of the naturally occurring stuff that came with the planet, before it's been altered, extracted, transformed, or used up for production. It includes the air, water, land, vegetation, and wildlife.
Visit the GLOSS*arama
|
|


|

|
                           SUPPLY SCHEDULE: A table that illustrates the alternative quantities of a commodity supplied at different prices. A supply schedule is a simple means of summarizing information about supply price and quantity supplied for a particular good. It is used to highlight the law of supply. It can also be used to derive a supply curve. A supply schedule is a useful set of information that can summarize several of the more important aspects of supply. Setting Up the Table| Supply Schedule | 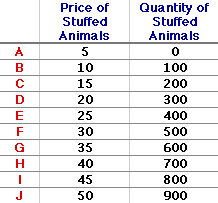 |
The table in this exhibit displays the Shady Valley supply schedule for stuffed Yellow Tarantulas, a cute and cuddly stuffed creature from the Wacky Willy Stuffed Amigos line of collectibles.This table contains three columns. The first contains reference labels A, B, C, etc. for each price-quantity pair. The second is the supply price, ranging from $5 to $50. And the third is the quantity supplied, ranging from 0 to 900 Yellow Tarantulas. This schedule assumes other ceteris paribus factors remain unchanged and that the quantities are those supplied during a one year time period. Running Through the NumbersHere are a few observations about this supply schedule. - First, as the price increases from a low of $5 to a high of $50, the quantity supplied of Yellow Tarantulas increases from 0 to 900. Higher prices are related to larger quantities. This relation, this direct relation between supply price and quantity supplied, IS the basic law of supply.
- Second, the quantities in the schedule represent maximum values. That is, if the price is $10, then the maximum quantity supplied is 100 Yellow Tarantulas. It is not 150, nor even 101, but only 100. Alternatively, the prices in the schedule represent minimum values. If sellers offer 100 Yellow Tarantulas for sale, then the minimum supply price they are willing and able to accept is $10, not $5, not even $9.99, but $10.
- Third, this whole schedule, all ten pairs of the price-quantity numbers (and all others that could be included) is supply. Supply is the entire range of prices and quantities, all pairs. In contrast, quantity supplied is any specific number of Yellow Tarantulas sellers are willing and able to sell at a specific supply price. Selecting a different price generates a different quantity supplied.
- Fourth, these numbers are hypothetical, not just in the sense that they were made up to illustrate supply, but in the sense that they suggest a "What if" relation. This particular schedule does not indicate the actual supply price of Yellow Tarantulas nor the actual quantity supplied. It only indicates quantity supplied given the supply price, or supply price given the quantity supplied. If, for example, the supply price is $10, then sellers are willing and able to sell 100 Yellow Tarantulas. This does not mean that sellers will sell, are selling, or ever will sell 100 Yellow Tarantulas. It only indicates what they would sell at a $10 price.
Recommended Citation:SUPPLY SCHEDULE, AmosWEB Encyclonomic WEB*pedia, http://www.AmosWEB.com, AmosWEB LLC, 2000-2025. [Accessed: June 30, 2025].
Check Out These Related Terms... | | | | | | | | | | |
Or For A Little Background... | | | | | | | | | | | | |
And For Further Study... | | | | | | | | |
Search Again?
Back to the WEB*pedia
|

|

|
|
General Electric is the only stock from the original 1896 Dow Jones Industrial Average remaining in the current index.
|

|
|
"I learned about the strength you can get from a close family life. I learned to keep going, even in bad times. I learned not to despair, even when my world was falling apart. I learned that there are no free lunches. And I learned the value of hard work. " -- Lee Iacocca
|

|
CES
Constant Elasticity of Substitution
|

|
|
Tell us what you think about AmosWEB. Like what you see? Have suggestions for improvements? Let us know. Click the User Feedback link.
User Feedback
|

|

