|
|
COMMUNICATION: The process by which ideas, thoughts, and subsequent feedback is accomplished through encoding, sending, and decoding. In order for effective communication to occur the sender must understand the target audience and encode the message in a way that will be understood. This message is sent in various forms and can be distorted by interference prior to reaching the receiver. Receiver then interprets the message and performs required action and gives necessary feedback to the sender. Utilizing this process correctly is an integral part of the promotion element in the marketing mix.
Visit the GLOSS*arama
|
|


|

|
                           TOTAL REVENUE: The revenue received by a firm for the sale of its output. Total revenue is one two bits of information a firm needs to calculate economic profit, the other is total cost. In general, total revenue is the price times quantity--the price received for selling a good times the quantity of the good sold at that price. For a perfectly competitive firm, which receives a single unchanging price for all output sold, the calculation is relatively easy. For other real world firms, that charge different prices to different buyers for different quantities, the calculation can be more complex. Two other revenue measures directly related to total revenue are average revenue and marginal revenue. Total revenue is often depicted as a total revenue curve. Total revenue is important to the analysis a firm's short-run production decision. A firm generally seeks to produce the quantity of output that maximizes profit, which is the difference between total revenue and total cost.Total revenue can be represented in a table or as a curve. For a perfectly competitive firm, the total revenue curve is a straight line that emerges from the origin. For a monopoly, oligopoly, or monopolistically competitive firm, the total revenue curve is a "hump-shaped" curve, increasing at a decreasing rate, reaching a peak, then declining. The total revenue received by a firm is price times quantity, often expressed as this simple equation: | total revenue | = | price | x | quantity |
Perfect CompetitionThe essence of total revenue is best illustrated by perfect competition. Perfect competition is a market structure with a large number of small firms, each selling identical goods. Perfectly competitive firms have perfect knowledge and perfect mobility into and out of the market. These conditions mean perfectly competitive firms are price takers, they have no market control and receive the going market price for all output sold.Total Revenue,
Zucchini Style |  |
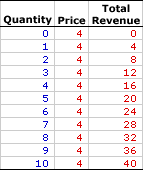
The table to the right summarizes the total revenue received by a hypothetical firm, Phil the zucchini grower, for selling zucchinis in a perfectly competitive zucchini market. The first column is the quantity of zucchinis sold, ranging from 0 to 10 pounds. The second column is the price Phil receives for selling his zucchinis, which is $4 per pound. The third column is then the total revenue Phil receives for producing and selling alternative quantities of zucchinis. If Phil sells only one zucchini, then he receives only $4. If he sells five zucchinis, he receives $20. In each case, total revenue in column three is calculated as the quantity in the first column multiplied by the price in the second column. Consider a few highlights of these total revenue numbers. - First, total revenue is zero if Phil sells no zucchinis. This makes sense. If nothing is sold, no revenue is received.
- Second, the price remains unchanged. Phil can sell 1 pound of zucchinis or 10 pounds of zucchinis for the same $4 price.
- Third, as Phil sells more zucchinis he receives more total revenue. Moreover, because the price remains fixed, the only way for Phil to obtain more total revenue is to sell more zucchinis.
- Fourth and last, for each extra pound of zucchinis Phil sells, he receives an extra $4 of revenue. This suggests an important role of marginal revenue in the short-run production analysis of a perfectly competitive firm.
Total Revenue Curve,
Zucchini Style |  |
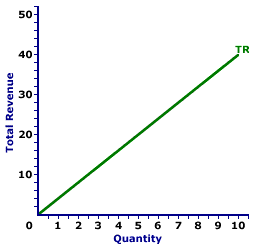
Total revenue is commonly represented by a total revenue curve, such as the one displayed in the exhibit to the right. This particular total revenue curve is that for zucchini sales by Phil the zucchini grower. The vertical axis measures total revenue and the horizontal axis measures the quantity of output (pounds of zucchinis). Although quantity on this particular graph stops at 10 pounds of zucchinis, the nature of perfect competition indicates it could go higher. This curve indicates that if Phil sells 1 pound of zucchinis, then he receives $4 of total revenue. Alternatively, if he sells 10 pounds, then he receives $40 of total revenue. Should he sell 100 pounds, then he would move well beyond the graph, with $400 of total revenue. The "curve" is actually a "straight line" because Phil is a price taker in the zucchini market. He receives $4 for each pound of zucchinis sold whether he sells 1 pound or 10 pounds. The constant price is what makes Phil's total revenue curve a straight line. Monopoly, Oligopoly, and Monopolistic CompetitionFor market structures like monopoly, oligopoly, and monopolistic competition that are price makers rather than price takers, total revenue is little different. Although it is calculated as price times quantity, market control means these market structures face negatively-sloped demand curves. As such, the price received is not fixed, but depends on the quantity of output sold.Total Revenue,
Medicine Style |  |
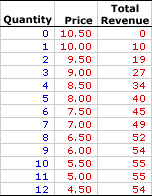
The table to the right summarizes the total revenue received by another hypothetical firm, Feet-First Pharmaceutical. This firm owns the patent to Amblathan-Plus, the only cure for the deadly foot ailment known as amblathanitis. As the only producer of Amblathan-Plus, Feet-First Pharmaceutical is a monopoly with extensive market control, facing a negatively-sloped demand curve. To sell a larger quantity of Amblathan-Plus, Feet-First Pharmaceutical must lower the price.Consider a few tidbits of information about total revenue for a firm with market control. - First, like perfect competition, total revenue is zero if Feet-First Pharmaceutical sells no medicine. This makes sense. If nothing is sold, no revenue is received.
- Second, the price changes with the quantity of output sold. Feet-First Pharmaceutical can sell 1 ounce of medicine for $10 per ounce. However, if it choses to sell 5 ounces, then it must lower the price to $8 per ounce.
- Third, as Feet-First Pharmaceutical sells more medicine it receives more total revenue... UP TO A POINT. While total revenue received by Feet-First Pharmaceutical increases for the first 10 ounces sold, it declines for the 12th ounce.
- Fourth and last, unlike perfect competition, the extra revenue generated for selling more medicine is not constant nor is it equal to the price. For example, the 5th ounce of medicine adds a extra $6 of revenue even though the price is $8.
Total Revenue Curve,
Medicine Style |  |
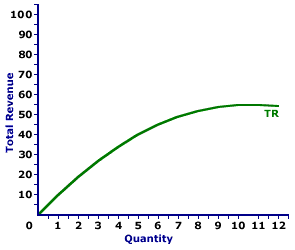
The total revenue curve for firms with market control looks a little different than that for perfect competition. The total revenue curve for Feet-First Pharmaceutical is displayed in the exhibit to the right. Key to this curve is that Feet-First Pharmaceutical is a monopoly provider of a drug called Amblathan-Plus and thus faces a negatively-sloped demand curve. Larger quantities of output are only possible with lower prices.The vertical axis measures total revenue and the horizontal axis measures the quantity of output (ounces of medicine). Although quantity on this particular graph stops at 12 ounces of medicine, it could go higher. This curve indicates that if Feet-First Pharmaceutical sells 1 ounce of medicine (at $10 per ounce), then it receives $10 of total revenue. Alternatively, if it sells 10 ounces (at $5.50 per ounce), then it receives $55 of total revenue. Should it sell 12 ounces (at $4.50 per ounce), then it receives only $54 of total revenue. For Feet-First Pharmaceutical the total revenue "curve" actually is a "curve." The slope of this curve falls as more output is produced, eventually reaching a peak, then becoming negative. The changing slope of this curve is due to the changing price. Although this total revenue curve, and preceding table of total revenue numbers, is based on the production activity of Feet-First Pharmaceutical, a well-known monopoly firm, it could also be for any firm with market control. Monopolistic competition and oligopoly firms that also face negatively-sloped demand curves generate comparable total revenue.

Recommended Citation:TOTAL REVENUE, AmosWEB Encyclonomic WEB*pedia, http://www.AmosWEB.com, AmosWEB LLC, 2000-2025. [Accessed: June 30, 2025].
Check Out These Related Terms... | | | | | | | | | | |
Or For A Little Background... | | | | | | | | | | | | | | | |
And For Further Study... | | | | | | | | | |
Related Websites (Will Open in New Window)... | | | |
Search Again?
Back to the WEB*pedia
|


|

|
ORANGE REBELOON
[What's This?]
Today, you are likely to spend a great deal of time browsing through a long list of dot com websites wanting to buy either a Boston Red Sox baseball cap or a square lamp shade with frills along the bottom. Be on the lookout for pencil sharpeners with an attitude.
Your Complete Scope
This isn't me! What am I?
|

|
|
The word "fiscal" is derived from a Latin word meaning "moneybag."
|

|
|
"I learned about the strength you can get from a close family life. I learned to keep going, even in bad times. I learned not to despair, even when my world was falling apart. I learned that there are no free lunches. And I learned the value of hard work. " -- Lee Iacocca
|

|
L/C
Letter of Credit
|

|
|
Tell us what you think about AmosWEB. Like what you see? Have suggestions for improvements? Let us know. Click the User Feedback link.
User Feedback
|


|


