|
|
RESERVE REQUIREMENTS: Rules by the Federal Reserve System governing the amount of bank reserves that banks must keep to back up their deposits. Legal reserve requirements came about because banks that practice fractional-reserve banking are sometimes inclined to make too many interest-paying loans and neglect to keep enough reserves on hand to pay their depositors. In principle, the Fed can alter reserve requirements to control the money supply. In practice, however, the Fed prefers to use open market operations or the discount rate.
Visit the GLOSS*arama
|
|


|

|
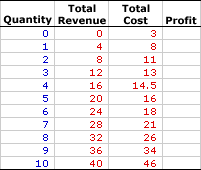
                           PERFECT COMPETITION, PROFIT ANALYSIS: A perfectly competitive firm produces the profit-maximizing quantity of output that generates the highest level of profit. This profit approach is one of three methods that used to determine the profit-maximizing quantity of output. The other two methods involve a comparison of total revenue and total cost or a comparison of marginal revenue and marginal cost. Perfect competition is a market structure characterized by a large number of small firms producing identical products with perfect resource mobility and perfect knowledge. These conditions mean a perfectly competitive firm faces a horizontal, or perfectly elastic, demand curve. With this horizontal demand curve, marginal revenue is equal to average revenue, both of which are also equal to price. Comparable to any profit-maximizing firm, a perfectly competitive firm produces the quantity of output in the short run that generates the maximum difference between total revenue with total cost, which is economic profit. At this production level, the firm cannot increase profit by changing the level of production. The analysis of profit can be achieved through a table of numbers or by a comparison of total revenue and total cost curves. Working the NumbersA perfectly competitive firm is presumed to produce the quantity of output that maximizes economic profit--the difference between total revenue and total cost. This decision can be analyzed using the exhibit below. This table presents revenue and cost information for Phil the zucchini grower, a hypothetical example of a perfectly competitive firm.Because the zucchinis Phil produces are identical to those produced by gadzillions of other zucchini growers, he has no market control and must sell his zucchinis at the going market price of $4 per pound. Phil is a price taker. Phil's status as a perfectly competitive, price-taking firm is reflected in this table. | The Zucchini Numbers |  |
- Quantity: The first column presents the quantity of output produced, ranging from 0 to 10 pounds of zucchinis.
- Total Revenue: The second column presents total revenue, ranging from a low of $0 for no output to a high or $40 for 10 pounds of zucchinis. If Phil sells 1 pound of zucchinis, he receives $4 in total revenue. Total revenue is $8 for 2 pounds of zucchinis. The total revenue in the second column is the $4 market price times the quantity of zucchinis sold.
- Total Cost: The third column presents the total cost incurred by the firm in the production of this output, ranging from a low of $3 for zero output to a high of $46 for 10 pounds of zucchinis. Because Phil has fixed cost, he incurs $3 of total cost even though he produces no zucchinis. Producing 1 pound of zucchinis incurs a total cost of $8. Producing 2 pounds of zucchinis incurs a total cost of $11. Total cost rises as Phil produces more.
- Profit: The fourth column at the far right of the table is available to display economic profit, the difference between total revenue in the second column and total cost in the third column. A click of the [Profit] button displays Phil's economic profit in the fourth column.
The task is to determine the economic profit Phil earns for each quantity of zucchinis produced, then to identify which zucchini production level provides the maximum profit. A click of the [Incurring Losses] button indicates that Phil incurs an economic loss for the first 3 pounds of zucchinis. Producing and selling 1 pound of zucchini generates an economic loss of $4. Total revenue is $4 and total cost is $8. A $3 loss results from 2 pounds of zucchinis. In fact, Phil also incur an economic lose by producing 10 pounds of zucchinis. But loss is not what Phil seeks. Click the [Earning Profits] button to highlight the range of production levels that generate positive economic profit. Phil initially turns his profit picture around with 4 pounds of zucchinis. At 4 pounds of zucchinis Phil's total revenue is less than his total cost by $1.50. Profit remains positive through the production of 9 pounds of zucchinis, Phil's total revenue exceeds his total cost and Phil receives an economic profit. For 6 pounds of zucchinis, this profit is $6, for 7 profit is $7, and for 8 profit drops back to $6 again. So what is the profit-maximizing level of zucchini production Phil should undertake? The desired production level is clearly not 3 pounds or less, nor is it 10 pounds (or more), all of which lead to economic loss. It must be within the highlighted range between 4 and 9. The quantity that generates the greatest of economic profit is 7 pounds of zucchinis. This alternative can be highlighted by clicking the [Profit Max] button. The production of 7 pounds of zucchinis results in $28 of total revenue and $21 of total cost, a difference of $7. No other production level generates a greater economic profit. Producing 1 more pound of zucchinis or 1 less pound of zucchinis reduces profit to $6. Working the Curves| The Zucchini Curves |  |
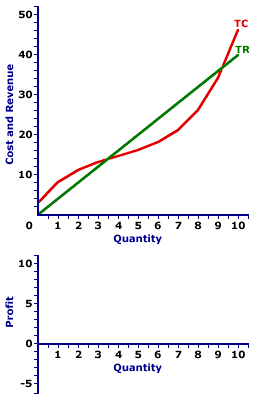
The short-run production decision for a perfectly competitive firm can be graphically illustrated by deriving a profit curve from the total revenue and total cost curves. The lower panel of the exhibit to the right is standing poised to display the profit curve for Phil's zucchini production.- Total Revenue: The straight green line labeled TR depicts the total revenue that Phil receives from zucchini production. The line is straight, with a constant slope, because the price is constant at $4.
- Total Cost: The curvy red line labeled TC represents the total cost that Phil incurs in the production of zucchinis. The shape is based on increasing, then decreasing marginal returns.
- Profit: The vertical difference between these two lines is economic profit. If the total revenue line is above the total cost line in the middle of the diagram, economic profit is positive. If the total revenue line is below the total cost line at the far right and far left, economic profit is negative. The profit curve can be displayed in the lower panel by clicking the button labeled [Profit Curve].
Three segments of this profit curve are worth noting.- First, profit is negative (that is, Phil incurs an economic loss) for small quantities of output where the profit curve lies below the horizontal axis. Phil does not want to produce in this range.
- Second, profit is positive for larger quantities of output where the profit curve rises above the horizontal axis. Phil does want to produce in this range.
- Third, profit then becomes negative once again for the largest quantities of output where the profit curve dips below the horizontal axis again.
The key for Phil is to identify the production level that attains the peak of the profit curve. This is probably evident by looking at the exhibit, but it can be highlighted by clicking the [Profit Max] button. The output quantity identified is, once again, 7 pounds of zucchinis.Before leaving this graph, two other quantities can be highlighted. The profit curve intersects the horizontal axis (meaning profit is zero) at two quantities--about 3.5 pounds of zucchinis and just over 9 pounds of zucchinis. Click the [Breakeven] button to highlight these two output levels. Both quantities are termed breakeven output. Breakeven output is a quantity of output in which the total revenue is equal to total cost such that a firm earns exactly a normal profit, and thus receives no economic profit nor incurs an economic loss. The reason for the term "breakeven" output is that the firm is just "breaking even." It is neither making a profit nor incurring a loss. Economic profit is zero. Breakeven output is usually most noteworthy as a reference point. The profit-maximizing production level invariably occurs between the two breakeven output levels.

Recommended Citation:PERFECT COMPETITION, PROFIT ANALYSIS, AmosWEB Encyclonomic WEB*pedia, http://www.AmosWEB.com, AmosWEB LLC, 2000-2025. [Accessed: July 18, 2025].
Check Out These Related Terms... | | | | | | | |
Or For A Little Background... | | | | | | | | | |
And For Further Study... | | | | | |
Search Again?
Back to the WEB*pedia
|


|

|
PURPLE SMARPHIN
[What's This?]
Today, you are likely to spend a great deal of time flipping through mail order catalogs trying to buy either a flower arrangement for your aunt or a birthday greeting card for your uncle. Be on the lookout for rusty deck screws.
Your Complete Scope
This isn't me! What am I?
|

|
|
Francis Bacon (1561-1626), a champion of the scientific method, died when he caught a severe cold while attempting to preserve a chicken by filling it with snow.
|

|
|
"A winner is someone who recognizes his God-given talents, works his tail off to develop them into skills, and uses those skills to accomplish his goals. " -- Larry Bird, basketball player
|

|
JEH
Journal of Economic History
|

|
|
Tell us what you think about AmosWEB. Like what you see? Have suggestions for improvements? Let us know. Click the User Feedback link.
User Feedback
|


|


