|
|
LEVERAGED BUYOUT: A method of corporate takeover or merger popularized in the 1980s in which the controlling interest in a company's corporate stock was purchased using a substantial fraction of borrowed funds. These takeovers were, as the financial-types say, heavily leveraged. The person or company doing the "taking over" used very little of their own money and borrowed the rest, often by issuing extremely risky, but high interest, "junk" bonds. These bonds were high-risk, and thus paid a high interest rate, because little or nothing backed them up.
Visit the GLOSS*arama
|
|


|

|
                           SELF CORRECTION, AGGREGATE MARKET: The automatic process in which the aggregate market adjusts from short-run equilibrium to long-run equilibrium. Self-correction results through shifts of the short-run aggregate supply curve caused by changes in wages (and other resource prices). The self-correction mechanism acts to close both recessionary gaps and inflationary gaps. The short-run aggregate supply curve increases (shifts rightward) due to lower wages to close a recessionary gap and decreases (shifts leftward) due to higher wages to close an inflationary gap. Short-run equilibrium in the aggregate market is characterized by inflexible or rigid resource prices, especially wages. This creates temporary imbalances in resource markets, especially cyclical unemployment and overemployment of labor. Self-correction is the process in which these temporary imbalances are eliminated through flexible prices (especially changes in wages) and the aggregate market achieves long-run equilibrium. The self-correction adjustment process closes both recessionary gaps (with lower wages) and inflationary gaps (with higher wages).Two Output Gaps| Output Gaps |  | Recessionary Gap |  | Inflationary Gap |  |
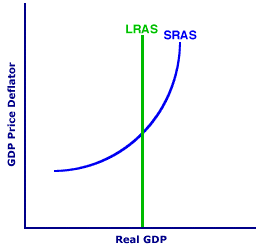
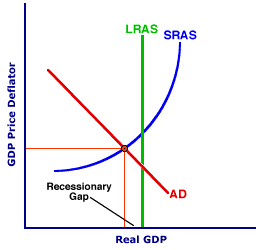
The self-correct process closes both recessionary and inflationary gaps. These two output gaps can be illustrated using the graph presented in the exhibit to the right. This graph presents the two aggregate supply curves--long run and short run--but no aggregate demand curve. The vertical curve labeled LRAS is the long-run aggregate supply curve which marks full-employment real production. The positively-sloped curve labeled SRAS is then the short-run aggregate supply curve. The positioning of the aggregate demand curve and the point of intersection with the short-run aggregate supply curve indicates whether the short-run equilibrium generates a recessionary gap or an inflationary gap. - Recessionary Gap: Click the [Recessionary Gap] button to reveal this output gap. With a recessionary gap, short-run equilibrium real production is less than full-employment real production, meaning resource markets have surpluses, and in particular labor is unemployed. The long-run result is lower wages and an increase in short-run aggregate supply.
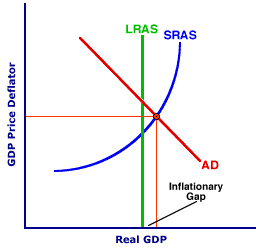
- Inflationary Gap: Click the [Inflationary Gap] button to reveal this output gap. With an inflationary gap, short-run equilibrium real production is greater than full-employment real production, meaning resource markets have shortages, and in particular labor is overemployed. The long-run result is higher wages and a decrease in short-run aggregate supply.
Closing A Recessionary GapTo see how self-correction closes a recessionary gap, consider the recessionary gap presented in the exhibit to the right. This graph reveals a short-run equilibrium that lies to the left of the LRAS curve and which is less than full employment real production. This particular recessionary gap is, in all likelihood, the result of a decrease in aggregate demand and a leftward shift of the AD curve. A recessionary gap persists in the short run because inflexible wages and resource prices do not decline enough to eliminate unemployment and achieve equilibrium in the labor and resource markets.However, in the long run, wages and resource prices ARE flexible and they DO decline enough to eliminate imbalances in the resource markets. The result of declining wages (and other resource prices) is a reduction in production cost. A decrease in production cost causes an increase in short-run aggregate supply, or a rightward shift of the SRAS curve. Click the [Lower Wages] button to demonstrate. Note that the SRAS curve shifts rightward until it intersects BOTH the LRAS and AD curves at full-employment real production, which is long-run equilibrium. In particular, the new long-run equilibrium is at the full-employment level of real production. The SRAS curve absolutely MUST shift until this long-run equilibrium is reached. If the aggregate market does NOT reach long-run equilibrium, resource market imbalances persist, resource prices and production cost decline further, and the SRAS curve shifts more. However, once long-run equilibrium is reached, resource market imbalances are eliminated, resource prices and production cost do not change, and the SRAS curve does not shift any further. Closing An Inflationary GapTo see how self-correction closes an inflationary gap, consider the inflationary gap presented in the exhibit to the right. This graph reveals a short-run equilibrium that lies to the right of the LRAS curve and which is greater than full employment real production. This particular inflationary gap is, in all likelihood, the result of an increase in aggregate demand and a rightward shift of the AD curve. An inflationary gap persists in the short run due to a reduction in frictional and structural unemployment and imbalances in real resource prices that allow overemployment and prevent equilibrium in the labor and resource markets.However, in the long run, rising wages and resource prices allow employment to return to its natural, full-employment level and eliminate imbalances in real resource prices. The result of rising wages and resource prices is rising production cost. An increase in production cost causes a decrease in short-run aggregate supply, or a leftward shift of the SRAS curve. Click the [Higher Wages] button to demonstrate. Note that the SRAS curve shifts leftward until it intersects BOTH the LRAS and AD curves at full-employment real production, which is long-run equilibrium. In particular, the new long-run equilibrium is at the full-employment level of real production. The SRAS curve absolutely MUST shift until this long-run equilibrium is reached. If the aggregate market does NOT reach long-run equilibrium, resource market imbalances persist, resource prices and production cost rise further, and the SRAS curve shifts more. However, once long-run equilibrium is reached, resource market imbalances are eliminated, resource prices and production cost do not change, and the SRAS curve does not shift any further.

Recommended Citation:SELF CORRECTION, AGGREGATE MARKET, AmosWEB Encyclonomic WEB*pedia, http://www.AmosWEB.com, AmosWEB LLC, 2000-2025. [Accessed: July 18, 2025].
Check Out These Related Terms... | | | | | | | |
Or For A Little Background... | | | | | | | | | | | | | | | | | |
And For Further Study... | | | | | |
Search Again?
Back to the WEB*pedia
|


|

|
WHITE GULLIBON
[What's This?]
Today, you are likely to spend a great deal of time searching the newspaper want ads seeking to buy either an extra large beach blanket or a large flower pot shaped like a Greek urn. Be on the lookout for fairy dust that tastes like salt.
Your Complete Scope
This isn't me! What am I?
|

|
|
A lump of pure gold the size of a matchbox can be flattened into a sheet the size of a tennis court!
|

|
|
"A winner is someone who recognizes his God-given talents, works his tail off to develop them into skills, and uses those skills to accomplish his goals. " -- Larry Bird, basketball player
|

|
CME
Chicago Mercantile Exchange
|

|
|
Tell us what you think about AmosWEB. Like what you see? Have suggestions for improvements? Let us know. Click the User Feedback link.
User Feedback
|


|


