
|
|
INFLATIONARY GAP, KEYNESIAN MODEL: The difference between equilibrium aggregate production achieved in the Keynesian model and full-employment aggregate production that occurs when equilibrium aggregate production is greater than full-employment aggregate production. An inflationary gap, also termed an expansionary gap, is associated with a business-cycle expansion. The prescribed Keynesian remedy for an inflationary gap is contractionary fiscal policy. This is one of two alternative output gaps that can occur when equilibrium generates production that differs from full employment. The other is a recessionary gap.
Visit the GLOSS*arama
|
|


|

|
                           MARSHALLIAN CROSS: A diagram illustrating the market model, with price measured on the vertical axis and quantity measured on the horizontal axis, with the law of demand represented as a downward-sloping demand curve and the law of supply represented as an upward-sloping supply curve. The derivation of this name comes from the "Marshall" part of noted economist Alfred Marshall, and the intersection or "cross" of the demand and supply curves achieved at that market equilibrium. Marshallian cross is a somewhat dated reference to the standard market model diagram. The name pays tribute to Alfred Marshall, the economist responsible for formally developing this analysis in the late 1800s. It also provides contrast with another fundamental economic diagram, the Keynesian cross.| The Marshallian Cross | 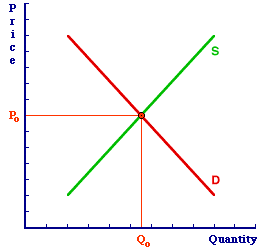 |
This exhibit illustrates the basic Marshallian cross market model diagram. The vertical axis measures the price of the good. The horizontal axis measures the quantity of the good exchanged. The negatively-sloped demand curve, D, represents the law of demand. The positively-sloped supply curve, S, represents the law of supply.The intersection of the demand curve and supply curve at price Po and quantity Qo is the market equilibrium. A shift in either curve, caused by changes in the demand or supply determinants, results in a new equilibrium at, in all likelihood, a new price and new quantity. An interesting little twist to the Marshallian cross was added by Alfred Marshall. Conventional graphical analysis usually displays the independent variable (X) on the horizontal axis and the dependent variable (Y) on the vertical axis. This allows analytical types to manipulate the X-independent-variable and observe how the Y-dependent-variable changes. In the Marshallian cross, quantity would then be the X-independent variable and the price the Y-dependent variable. However, this configuration contrasts with typical uses of the market. Economists generally view price as the independent variable and quantity as the dependent variable. That is, they are concerned with how the price affects the quantity. In this context, price would work better on the horizontal axis, with quantity on the vertical. By convention and tradition, the placement of the two variables is reversed.
Recommended Citation:MARSHALLIAN CROSS, AmosWEB Encyclonomic WEB*pedia, http://www.AmosWEB.com, AmosWEB LLC, 2000-2025. [Accessed: July 18, 2025].
Check Out These Related Terms... | | | | | | |
Or For A Little Background... | | | | | |
And For Further Study... | | | | | | | | | | |
Search Again?
Back to the WEB*pedia
|

|

|
PURPLE SMARPHIN
[What's This?]
Today, you are likely to spend a great deal of time flipping through mail order catalogs trying to buy either a flower arrangement for your aunt or a birthday greeting card for your uncle. Be on the lookout for rusty deck screws.
Your Complete Scope
This isn't me! What am I?
|

|
|
Parker Brothers, the folks who produce the Monopoly board game, prints more Monopoly money each year than real currency printed by the U.S. government.
|

|
|
"A winner is someone who recognizes his God-given talents, works his tail off to develop them into skills, and uses those skills to accomplish his goals. " -- Larry Bird, basketball player
|

|
MLR
Minimum Lending Rate
|

|
|
Tell us what you think about AmosWEB. Like what you see? Have suggestions for improvements? Let us know. Click the User Feedback link.
User Feedback
|

|






