|
|
RISK NEUTRAL: A person who values a certain income the same as an equal amount of income that involves risk or uncertainty. Let's say that you're given two options--(A) a guaranteed $1,000 or (b) a 50-50 chance of getting either $500 or $1,500. If you don't really care which option you chose, because both options have the same "expected" values, then you're risk neutral.
Visit the GLOSS*arama
|
|


|

|
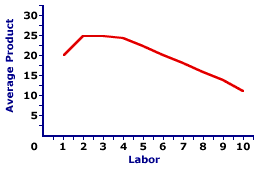
                           AVERAGE PRODUCT CURVE: A curve that graphically illustrates the relation between average product and the quantity of the variable input, holding all other inputs fixed. This curve indicates the per unit output at each level of the variable input. The average product curve is one of three related curves used in the analysis of the short-run production of a firm. The other two are total product curve and marginal product curve. The average product curve illustrates how average product is related to a variable input. While the standard analysis of short-run production relates average product to labor, an average product curve can be constructed for any variable input. | Average Product Curve |  |
The diagram to the right graphically represents the relation between average product and the variable input. This particular curve is derived from the hourly production of Super Deluxe TexMex Gargantuan Tacos (with sour cream and jalapeno peppers) as Waldo's TexMex Taco World restaurant employs additional workers. The number of workers, measured on the horizontal axis, ranges from 0 to 10 and the average Gargantuan Taco production per worker, measured on the vertical axis, ranges from 0 to 25.The shape of this average product curve is worth noting. For the first two workers of variable input, average product increases. This is reflected in a positive slope of the average product curve. After the third worker, the average product declines. This is seen as a negative slope. While average product continues to decline, it never reaches zero nor becomes negative. To do so would require total product to become zero and negative, which just does not happen. The hump-shape of the average product curve indirectly results from increasing and decreasing marginal returns. The upward-sloping portion of the average product curve, up to the second worker, is indirectly due to increasing marginal returns. The downward-sloping portion of the average product curve, after the third worker, is indirectly due to decreasing marginal returns. and the law of diminishing marginal returns.

Recommended Citation:AVERAGE PRODUCT CURVE, AmosWEB Encyclonomic WEB*pedia, http://www.AmosWEB.com, AmosWEB LLC, 2000-2025. [Accessed: July 18, 2025].
Check Out These Related Terms... | | | | | | | | | |
Or For A Little Background... | | | | | | | | | | | | | |
And For Further Study... | | | | | | | |
Search Again?
Back to the WEB*pedia
|


|

|
BEIGE MUNDORTLE
[What's This?]
Today, you are likely to spend a great deal of time strolling around a discount warehouse buying club hoping to buy either a case for your designer sunglasses or arch supports for your shoes. Be on the lookout for crowded shopping malls.
Your Complete Scope
This isn't me! What am I?
|

|
|
In the early 1900s around 300 automobile companies operated in the United States.
|

|
|
"A winner is someone who recognizes his God-given talents, works his tail off to develop them into skills, and uses those skills to accomplish his goals. " -- Larry Bird, basketball player
|

|
DDA
Demand Deposits Accounts
|

|
|
Tell us what you think about AmosWEB. Like what you see? Have suggestions for improvements? Let us know. Click the User Feedback link.
User Feedback
|


|


