|
|
PERFECT PRICE DISCRIMINATION: A form of price discrimination in which a seller charges the highest price that buyers are willing and able to pay for each quantity of output sold. This is also termed first-degree price discrimination because the seller is able to extract ALL consumer surplus from the buyers. This is one of three price discrimination degrees. The others are second-degree price discrimination and third-degree price discrimination.
Visit the GLOSS*arama
|
|


|

|
                           AGGREGATE DEMAND AND MARKET DEMAND: The aggregate demand curve, or AD curve, has similarities to, but differences from, the standard market demand curve. Both are negatively sloped. Both relate price and quantity. However, the market demand curve is negatively sloped because of the income and substitution effects and the aggregate demand curve is negatively sloped because of the real-balance, interest-rate, and net-export effects. | Two Similar Curves | 
|
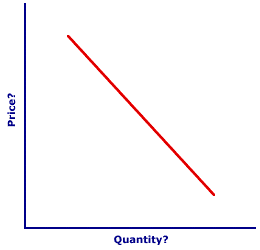
To illustrate the specific aggregate demand and market demand curve similarities and differences consider the graph of a negatively sloped curve displayed here. Is this a market demand curve or an aggregate demand curve? A cursory look suggests that it could be either.To reveal the similarities between the both curves, click the [Market Demand] and [Aggregate Demand] buttons. Doing so illustrates that both curves are negatively sloped, with each virtually overlaying the other. Consider the differences between these two curves. - First, note that for the market demand curve, the vertical axis measures demand price and the horizontal axis measures quantity demanded. For aggregate demand curve, however, the vertical axis measures the price level (GDP price deflator) and the horizontal axis measures real production (real GDP).
- Second, the negative slope of the market curve reflects the law of demand and is attributable to the income effect and the substitution effect. In contrast, the negative slope of the aggregate demand curve is based the real-balance effect, interest-rate effect, and net-export effect. Similar, but different.
Most notable, the differences between market demand and aggregate demand mean that it is not possible to merely add up, or aggregate, the market demand curves for the thousands of goods produced in the economy to derive the aggregate demand curve. The aggregate demand curve dances to its own music and plays be its own set of rules.

Recommended Citation:AGGREGATE DEMAND AND MARKET DEMAND, AmosWEB Encyclonomic WEB*pedia, http://www.AmosWEB.com, AmosWEB LLC, 2000-2025. [Accessed: July 18, 2025].
Check Out These Related Terms... | | | | | | | |
Or For A Little Background... | | | | | | | | | | | | |
And For Further Study... | | | | | | | |
Search Again?
Back to the WEB*pedia
|


|

|
WHITE GULLIBON
[What's This?]
Today, you are likely to spend a great deal of time searching the newspaper want ads seeking to buy either an extra large beach blanket or a large flower pot shaped like a Greek urn. Be on the lookout for fairy dust that tastes like salt.
Your Complete Scope
This isn't me! What am I?
|

|
|
Potato chips were invented in 1853 by a irritated chef repeatedly seeking to appease the hard to please Cornelius Vanderbilt who demanded french fried potatoes that were thinner and crisper than normal.
|

|
|
"A winner is someone who recognizes his God-given talents, works his tail off to develop them into skills, and uses those skills to accomplish his goals. " -- Larry Bird, basketball player
|

|
ARMA
Autoregressive Moving Average
|

|
|
Tell us what you think about AmosWEB. Like what you see? Have suggestions for improvements? Let us know. Click the User Feedback link.
User Feedback
|


|


