Average revenue product is the per unit revenue generated by the use or employment of different quantities of a variable input. It is closely related to the concept of average product (or average physical product). Average physical product indicates per unit total production from employing a given quantity of a variable input. Average revenue product, however, indicates per unit total revenue from employing a given quantity of a variable input. Average revenue product is also closely related to the concept of average revenue. Average revenue is per unit total revenue that results from producing a given quantity of output.Average revenue product can be derived by dividing total revenue by the quantity of variable input, as specified by this equation:
| average revenue product (MRP) | = | change in total revenue
change in variable input |
Three (or Four) Averages
Average revenue product is one of three (or four) related average concepts.- Average Product: This is per unit total product resulting from a given quantity of the variable factor input used.
- Average Physical Product: This is another term for average product which serves to emphasize that production is measured in physical units rather than monetary units.
- Average Revenue: This is the per unit total revenue generated from a given quantity of the output produced.
- Average Revenue Product: This is the per unit total revenue generated from a given quantity of the variable factor input used.
Average revenue product is average product stated in monetary units rather than physical units. Rather than stating productivity of an input in terms of the physical quantity of production, average revenue product states productivity in terms of the revenue generated.Suppose, for example, that Waldo's TexMex Taco World employs 6 workers who generate a total production of 120 tacos. The average (physical) product of these six workers is thus 20 tacos. However, because each taco sells for $2 each (average revenue), the average revenue generated per worker is $40.
Waldo, the owner of Taco World, is more interested in the amount of revenue generated when it comes to making out a paycheck, than just the number of tacos produced.
This connection between average product, average revenue, and average revenue product is summarized in by the following equation:
average
revenue product | = | average
product | x | average
revenue |
Average physical product, average revenue, and average revenue product are related beyond this equation. This relation reflects the basic production process of a profit-maximizing firm. A firm uses an input to produce output and the output is then sold. The firm transforms inputs into outputs according to constraints imposed by a production function. The firm then generates revenue by selling this output to wants-and-needs-satisfying buyers.
This process can be separated into two different links. Average (physical) product focuses on the first link, the physical input-output production relationship--the output produce per input used. Average revenue focuses on the second link, the revenue generated from selling the output. Average revenue product combines both links, showing the relationship between the input and the revenue generated from selling the output produced by the input.
The Value of Taco Production
| Average Taco Product |  |
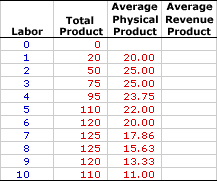
This table presents the hourly production of Shady Valley's favorite lunch time meal, Super Deluxe TexMex Gargantuan Tacos (with sour cream and jalapeno peppers), which can be used to investigate average revenue product. The column on the left is the variable input, specifically the number of workers employed by Waldo's TexMex Taco World, which ranges from 0 to 10. The second column is the total product, the total number of TexMex Gargantuan Tacos produced each hour, which ranges from a low of 0 to a high of 125 before declining to 110. Note that the taco production from these workers depends on a given amount of fixed inputs--Waldo's TexMex Taco World restaurant and all of the capital that goes with it.The third column presents average physical product. The average physical product for one worker is 20 tacos, the average physical product for two workers is 25 tacos, for three workers it is also 25 tacos, etc.
The far right column, which is currently empty, is available to display average revenue product. The first step needed to derive the average revenue product of taco production is to identify the average revenue, or price, of taco sales. Waldo's Taco World sells tacos at a constant price of $2. As such, 20 tacos generates $40 of revenue, 30 tacos generates $60 of revenue, etc.
With this information in hand, average revenue product can be derived by multiplying average physical product by average revenue (or the price of tacos). For an official display of all average revenue product values, click the [Average Revenue Product] button. The average revenue product of one worker is $20, the average revenue product of two workers is $40, for three workers it is $60, etc.
The proper economic interpretation of average revenue product is the average contribution of the variable inputs to total revenue. It answers the question: How much total revenue is generated, on average, by the inputs? If, for example, total revenue received by Taco World from selling tacos is $220 when five employees are working, then the conclusion is that the average revenue product of these five workers is $44. Does this mean that all five workers are equally productive? No, not at all. Or at least, not necessarily. Average revenue product is only a simple average. There is no indication of the actual contribution made by each of the five workers.
Perhaps the most important observation is that average revenue product declines after reaching a peak of $50 for three workers. This declining average revenue product corresponds with declining average physical product. And average physical product declines due to the law of diminishing marginal returns.
Average Revenue Product Curve
| Average Revenue Product Curve |  |
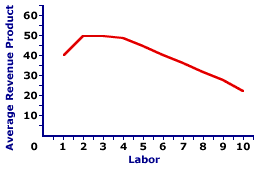
Average revenue product can be illustrated with the average revenue product curve. The average revenue product curve graphically illustrates the relation between average revenue product and the quantity of the variable input, holding all other inputs fixed. The curve displayed to the right is the average revenue product curve for taco production at Waldo's TexMex Taco World. It indicates the per unit total revenue for different amounts of the variable input. The shape of this curve is perhaps the most important thing to note. For the first two workers of variable input, average revenue product increases. This is reflected in a positive slope of the average revenue product curve. The curve levels off for three workers, then declines for four workers on. This is seen as a negative slope.
The hump-shape of the average revenue product curve embodies the essence of the analysis of short-run production. The upward-sloping portion of the average revenue product curve is indirectly due to increasing marginal returns and because marginal revenue product exceeds average revenue product. The downward-sloping portion of the average revenue product curve is indirectly due to decreasing marginal returns and because marginal revenue product is less than average revenue product.
AVERAGE REVENUE PRODUCT, AmosWEB Encyclonomic WEB*pedia, http://www.AmosWEB.com, AmosWEB LLC, 2000-2025. [Accessed: July 14, 2025].


