
|
|
LOANS: In general, transactions in which legal claims are exchanged for money. The legal claim is typically a contract or promissory note stipulating when and how the money will be repaid. The lender gives up the money and receives the legal claim. The borrower gives up the legal claim and receives the money. A loan can be either an asset or a liability, depending on who does the borrowing and who does the lending. To the borrower, a loan is a liability, something that is owed. The borrower must pay off the loan or repurchase the legal claim. However, to the lender, a loan is an asset, something that is owned. In fact, loans represent a significant part of a bank's assets.
Visit the GLOSS*arama
|
|


|

|
                           BREAKEVEN OUTPUT: The quantity of output in which the total revenue is equal to total cost such that a firm earns exactly a normal profit, but no economic profit. Breakeven output can be identified by the intersection of the total revenue and total cost curves, or by the intersection of the average total cost and average revenue curves. The most straightforward way of noting breakeven output, however, is with the profit curve. For a perfectly competitive firm breakeven output occurs where price is equal to average total cost. Breakeven Output
Profit Curve | 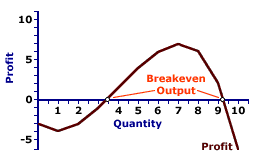 | Total Curves | 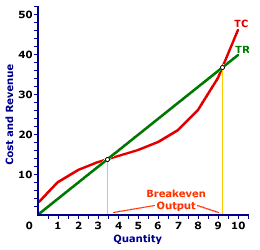 | Average Curves | 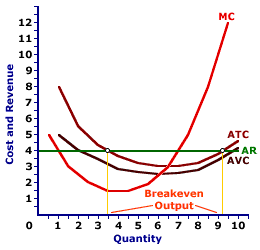 |
Breakeven output is a production level that achieves zero economic profit. In other words, a firm is just "breaking even." The total revenue received by a firm at the breakeven output just matches the total cost incurred. However, because total cost includes a normal profit, only economic profit is zero. A firm generally reports a positive accounting profit at the breakeven level of production.Breakeven output can be identified in one of three ways. This exhibit illustrates how breakeven output can be identified for a perfectly competitive firm, such as that operated by Phil the zucchini growing gardener. Phil sells zucchinis in a market with gadzillions of other zucchini growers and thus faces a going market price of $4 for each pound of zucchinis sold. Comparable to any firm, whether perfectly competitive or one with greater market control, Phil encounters a breakeven output level if total revenue is equal to total cost, average revenue is equal to average total cost, and profit is zero. In all three panels, Phil achieves breakeven output when producing about 3.5 pounds of zucchinis and when producing just over 9 pounds of zucchinis. The top panel presents the profit curve. The middle panel presents total revenue and total cost curves. The bottom panel presents average revenue and average total cost curves. - Profit: First, breakeven output can be illustrated with a direct evaluation of profit. If profit is zero, then breakeven output is achieved. In the top panel, the profit curve intersects the horizontal axis, meaning economic profit is zero, at these two output levels. At other output levels profit is either positive or negative.
- Total Revenue and Total Cost: Second, breakeven output can be identified by a comparison of total revenue and total cost. If the two are equal, then profit is zero and breakeven output is achieved. In the middle panel, the total revenue and total cost curves intersect at both production levels. At relatively low or relatively high output levels, the total cost curve is above the total revenue curve and economic profit is negative. At output levels in the middle of the chart, economic profit is positive as the total revenue curve lies above the total cost curve.
- Price and Average Cost: Third, breakeven output can be identified by a comparison of price (which is average revenue for a perfectly competitive firm) and average total cost. If per unit revenue is equal to per unit cost, then per unit profit is zero, overall profit is zero, and breakeven output is achieved. In the bottom panel, the average revenue and average total cost curves also intersect at both breakeven output levels. At relatively low or relatively high output levels, the average total cost curve is above the average revenue curve and economic profit is negative. At output levels in the middle of the graph, economic profit is positive as the average revenue curve lies above the average total cost curve.
While this discussion has been presented for a perfectly competitive firm, the story is essentially the same for firms operating in other market structures. The only difference is the shape and slope of the total revenue and average revenue curves. A monopoly, for example, faces a negatively-sloped demand curve. As such, the total revenue curve in the middle panel is a "hump-shaped" curve rather than a straight line and the average revenue curve in the bottom panel is negatively sloped.However, the breakeven points are identified in the same manner. They occur at the intersections of the total revenue and total cost curves and the intersections of the average revenue and average total cost curves.
Recommended Citation:BREAKEVEN OUTPUT, AmosWEB Encyclonomic WEB*pedia, http://www.AmosWEB.com, AmosWEB LLC, 2000-2025. [Accessed: July 18, 2025].
Check Out These Related Terms... | | | | |
Or For A Little Background... | | | | | | | | | | | | | | |
And For Further Study... | | | | | | | | |
Search Again?
Back to the WEB*pedia
|

|

|
WHITE GULLIBON
[What's This?]
Today, you are likely to spend a great deal of time searching the newspaper want ads seeking to buy either an extra large beach blanket or a large flower pot shaped like a Greek urn. Be on the lookout for fairy dust that tastes like salt.
Your Complete Scope
This isn't me! What am I?
|

|
|
The average bank teller loses about $250 every year.
|

|
|
"A winner is someone who recognizes his God-given talents, works his tail off to develop them into skills, and uses those skills to accomplish his goals. " -- Larry Bird, basketball player
|

|
MA(N)
A nth-order Moving Average Process
|

|
|
Tell us what you think about AmosWEB. Like what you see? Have suggestions for improvements? Let us know. Click the User Feedback link.
User Feedback
|

|

