
|
|
RATIONAL BEHAVIOR: The notion that people make decisions based on the desire to obtain the greatest amount of satisfaction. Rational behavior essential means that people prefer more to less. The presumption of rational behavior underlies most economic analyses, especially those applied to consumer demand theory.
Visit the GLOSS*arama
|
|


|

|
                           PROFIT CURVE: A curve that graphically represents the relation between the economic profit earned by a firm and the quantity of output sold. This curve is constructed to capture the relation between profit and the level of output, holding other variables, especially those affecting the total revenue and total cost curves, constant. The profit curve is commonly used to illustrate the profit-maximizing quantity of output produced by a firm. A profit curve can be derived directly form a table of profit and output quantity numbers. However, it is frequently obtained from a graph of the total revenue and total cost curves. The key feature of a profit curve is ease with which it illustrates the quantity of output that maximizes a firm's economic profit. The highest point on a profit curve is maximum profit.The derivation of a profit curve can be illustrated using the short-run production activities of a hypothetical firm, such as Phil the zucchini grower. Because Phil operates in a market structure characterized by a large number of small firms producing identical products with perfect resource mobility and perfect knowledge, he represents a perfectly competitive firm. However, the basic process is the much same for firms operating in other market structures. The only difference is the shape of the total revenue curve. | Zucchini Profit Curve | 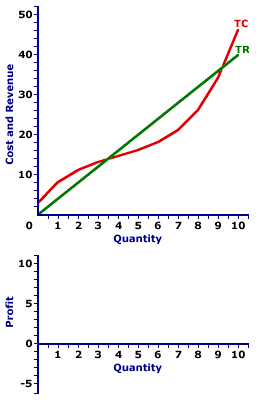 |
The derivation of Phil's profit curve can be graphically illustrated using the total revenue and total cost curves in this exhibit. The lower panel of the exhibit to the right is standing poised to display the profit curve for Phil's zucchini production.- Total Revenue: The straight green line labeled TR depicts the total revenue that Phil receives from zucchini production. The line is straight, with a constant slope, because the price is constant at $4.
- Total Cost: The curvy red line labeled TC represents the total cost that Phil incurs in the production of zucchinis. The shape is based on increasing, then decreasing marginal returns.
- Profit: The vertical difference between these two lines is economic profit. If the total revenue line is above the total cost line in the middle of the diagram, economic profit is positive. If the total revenue line is below the total cost line at the far right and far left, economic profit is negative. The profit curve can be displayed in the lower panel by clicking the button labeled [Profit Curve].
Three segments of this profit curve are worth noting.- First, profit is negative (that is, Phil incurs an economic loss) for small quantities of output where the profit curve lies below the horizontal axis. Phil does not want to produce zucchinis in this range.
- Second, profit is positive for larger quantities of output where the profit curve rises above the horizontal axis. Phil does want to produce in this range.
- Third, profit then becomes negative once again for the largest quantities of output where the profit curve dips below the horizontal axis again.
Once this profit curve has been derived, it can be used to identify the profit-maximizing level of production. The production level that attains the peak of the profit is probably evident by looking at the exhibit, but it can be highlighted by clicking the [Profit Max] button. The output quantity identified is 7 pounds of zucchinis.Before leaving this graph, two other quantities can be highlighted. The profit curve intersects the horizontal axis (meaning profit is zero) at two quantities--about 3.5 pounds of zucchinis and just over 9 pounds of zucchinis. Click the [Breakeven] button to highlight these two output levels. Both quantities are termed breakeven output. Breakeven output is a quantity of output in which the total revenue is equal to total cost such that a firm earns exactly a normal profit, and thus receives no economic profit nor incurs an economic loss. The reason for the term "breakeven" output is that the firm is just "breaking even." It is neither making a profit nor incurring a loss. Economic profit is zero. Breakeven output is usually most noteworthy as a reference point. The profit-maximizing production level invariably occurs between the two breakeven output levels.
Recommended Citation:PROFIT CURVE, AmosWEB Encyclonomic WEB*pedia, http://www.AmosWEB.com, AmosWEB LLC, 2000-2025. [Accessed: July 18, 2025].
Check Out These Related Terms... | | | |
Or For A Little Background... | | | | | | | | |
And For Further Study... | | | | | | | | | |
Search Again?
Back to the WEB*pedia
|

|

|
BROWN PRAGMATOX
[What's This?]
Today, you are likely to spend a great deal of time browsing through a long list of dot com websites seeking to buy either a case of blank recordable DVDs or a pair of red goulashes with shiny buckles. Be on the lookout for mail order catalogs with hidden messages.
Your Complete Scope
This isn't me! What am I?
|

|
|
Junk bonds are so called because they have a better than 50% chance of default, carrying a Standard & Poor's rating of CC or lower.
|

|
|
"A winner is someone who recognizes his God-given talents, works his tail off to develop them into skills, and uses those skills to accomplish his goals. " -- Larry Bird, basketball player
|

|
CLI
Cost of Living Index
|

|
|
Tell us what you think about AmosWEB. Like what you see? Have suggestions for improvements? Let us know. Click the User Feedback link.
User Feedback
|

|

