|
|
AGGREGATE PRODUCTION FUNCTION: A relation between the total production of real output for an economy and the amount of labor input. The aggregate production function is comparable to the standard production function used in the microeconomic analysis of firm behavior but is applied to the macroeconomic study of aggregate supply, resource markets, and employment. It is typically assumed to experience diminishing marginal returns, resulting in a decreasing marginal product of labor.
Visit the GLOSS*arama
|
|


|

|
                           DEMAND ELASTICITY AND TOTAL EXPENDITURE: The notion that price-induced changes in total expenditure (price times quantity) depend on the relative price elasticity of demand. If demand is relatively elastic, then changes in price cause total expenditure to change in the opposite direction. If demand is relatively inelastic, then changes in price cause total expenditure to change in the same direction. If demand is unit elastic, then changes in price do not cause any change in total expenditure. The total expenditure that buyers make when purchasing a good depends on the price elasticity of demand. The price elasticity of demand is the relative change in quantity demanded due to a change in price. Total expenditure is price times quantity.Because price and quantity change in opposite directions along a demand curve, changes in total expenditure depend on the relative changes in price and quantity. If price changes relatively less than quantity (elastic demand), then total expenditure changes in the opposite direction of price. If price changes relatively more than quantity (inelastic demand), then total expenditure changes in the same direction of price. Five Elasticity Alternatives| Digital Distance Demand |  |
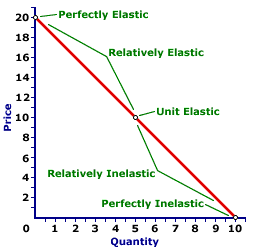
First, consider the relation between the five elasticity alternatives and a straight-line demand curve, such as the one for Digital Distance telephone services presented in this exhibit. The price ranges from 0 to 20 cents per minute and the quantity ranges from 0 to 10 million minutes per month.- The point of intersection between the demand curve and the vertical price axis is perfectly elastic (E=∞).
- The segment between the midpoint and the price-axis intercept is relatively elastic (1 < E < ∞).
- The exact middle, or midpoint, of the demand curve is unit elastic (E=1).
- The segment between the midpoint and the quantity-axis intercept is relatively inelastic (0 < E < 1).
- The intersection point between the demand curve and the horizontal quantity axis is perfectly inelastic (E=0).
As the price declines from a high of 20 cents per minute at the top left of the demand curve to a low of 0 cents per minute at the bottom right, the price elasticity of demand changes from infinite (E=∞) to zero (E=0).Calculating Total ExpenditureConsider now a few total expenditure calculations. Total expenditure is calculated as price times quantity.- For example, if the price is 18 cents per minute and the corresponding quantity demanded is 1 million minutes, then total expenditure on Digital Distance telephone services is $180,000 (= $0.18 x 1,000,000).
- Alternatively,if the price is 10 cents per minute and the corresponding quantity demanded is 5 million minutes, then total expenditure is $500,000 (= $0.10 x 5,000,000).
- Or, if the price is 2 cents per minute and the corresponding quantity demanded is 9 million minutes, then total expenditure on Digital Distance telephone services is also $180,000 (= $0.02 x 9,000,000).
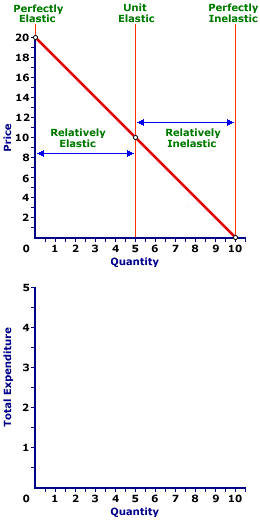
Note that as the price declines from 18 cents to 10 cents, total expenditure increases from $180,000 to $500,000. However, as the price declines further from 10 cents to 2 cents, total expenditure decreases from $500,000 to $180,000. This pattern of increasing then decreasing total expenditure is related to the changing price elasticity of demand on the demand curve.Total Expenditure and Demand| Making the Connection |  |
The relation between demand elasticity and total expenditure can be illustrated with the exhibit at the right. The top panel on this graph is the straight-line demand curve for Digital Distance telephone services with the five elasticity alternatives. The top segment of this demand curve is relatively elastic, the bottom portion is relative inelastic, and the midpoint is unit elastic.The bottom panel can be used to present the total expenditure curve derived from the demand curve. Total expenditure is found by multiplying the quantity by the corresponding price found on the demand curve. A quantity of 2 million minutes is associated with a price of 18 cents, giving a total expenditure of $180,000. A quantity of 5 million minutes is associated with a price of 10 cents and the total expenditure is $500,000. A quantity of 9 million minutes is associated with a price of 2 cents, also giving a total expenditure of $180,000. Other points on the total expenditure curve are identified in a like manner. Click the [Total Expenditure] button to reveal the curve plotted for each quantity. The result is an inverted-U shaped total expenditure curve. When quantity is zero, total expenditure is also zero, as the curve starts from the origin. As the quantity increases from 0 to 5 million minutes, total expenditure also rises. The curve peaks at 5 million minutes with a total expenditure of $500,000. The curve then declines until it reaches zero once again at a quantity of 10 million minutes. The shape of this curve is connected to the price elasticity of demand along the demand curve. Along the relatively elastic range of the demand curve, for prices between 20 and 10 cents per minute, lower prices induce greater total expenditure. Along the relatively inelastic range of the demand curve, for prices between 10 and 0 cents per minute, lower prices induce lower total expenditure. And the peak of the total expenditure curve, when total expenditure is neither rising nor falling, the demand curve is unit elastic. Click the [Five Alternatives] button to highlight this connection. What Does This Mean?An explanation for this relation rests with the fundamental concept of elasticity itself. Elasticity is the percentage change in quantity relative to the percentage change in price. Elastic demand means that the percentage change in quantity is greater than the percentage change in price. Inelastic demand means that the percentage change in quantity is less than the percentage change in price.Because total expenditure is calculated as price times quantity, any change in total expenditure results from changes in both price and quantity. As such, when a decrease in price causes the quantity to increase, then forces are working on total expenditure from both sides. The lower price works to decrease total expenditure and the larger quantity works to increase total expenditure. Which one wins? It depends on which change is greater. - For elastic demand, the percentage change in price is less than the percentage change in quantity. Quantity wins this battle. The reduction in total expenditure induced by the lower price is overwhelmed by the increase in total expenditure induced by the larger quantity, thus total expenditure increases with a price decrease.
- For inelastic demand, the percentage change in price is greater than the percentage change in quantity. Price wins this battle. The increase in total expenditure induced by the larger quantity is overwhelmed by the decrease in total expenditure induced by the lower price, thus total expenditure decreases with a price decrease.
This relation between demand elasticity and total expenditure is quite useful for businesses, government agencies, and others facing a downward-sloping demand curve for their product. The price elasticity of demand indicates if the seller can increase the total expenditure that buyers make to purchase the good (which is the total revenue received by the seller). If the seller is in the relatively elastic range of demand, then a price decrease causes an increase in total expenditure (and total revenue). If the seller is in the relatively inelastic range of demand, then a price increase causes an increase total expenditure (and total revenue). Of course, there are times when sellers get this exactly backwards. Government agencies that provide price-based services, such as transportation, are often inclined to move price in the wrong direction. They mistakenly think that THE ONLY WAY to increase revenue is to raise price. However, if the good in question is relatively elastic, then a higher price causes a relatively larger decrease in quantity and a decrease in the total revenue received, not an increase. Of course, they frequently compound this error by further raising price to compensate for the lost revenue, which causes further quantity decreases and even less revenue. And then they do it again, and again, and again....

Recommended Citation:DEMAND ELASTICITY AND TOTAL EXPENDITURE, AmosWEB Encyclonomic WEB*pedia, http://www.AmosWEB.com, AmosWEB LLC, 2000-2025. [Accessed: July 18, 2025].
Check Out These Related Terms... | | |
Or For A Little Background... | | | | | | | | |
And For Further Study... | | | | | | | |
Search Again?
Back to the WEB*pedia
|


|

|
PINK FADFLY
[What's This?]
Today, you are likely to spend a great deal of time calling an endless list of 800 numbers wanting to buy either a weathervane with a cow on top or a box of multi-colored, plastic paper clips. Be on the lookout for high interest rates.
Your Complete Scope
This isn't me! What am I?
|

|
|
In his older years, Andrew Carnegie seldom carried money because he was offended by its sight and touch.
|

|
|
"A winner is someone who recognizes his God-given talents, works his tail off to develop them into skills, and uses those skills to accomplish his goals. " -- Larry Bird, basketball player
|

|
OMB
Office of Management and Budget
|

|
|
Tell us what you think about AmosWEB. Like what you see? Have suggestions for improvements? Let us know. Click the User Feedback link.
User Feedback
|


|


