
|
|
ECONOMIC COMMISSION FOR LATIN AMERICA: The Economic Commission for Latin America (ECLA) -the Spanish acronym is CEPAL- was established in 1948. ECLAC, which is headquartered in Santiago, Chile, is one of the five regional commissions of the United Nations. It was founded for the purposes of contributing to the economic development of Latin America, coordinating actions directed towards this end, and reinforcing economic relationships among the countries and with the other nations of the world. The promotion of the region's social development was later included among its primary objectives. The 33 countries of Latin America and the Caribbean are member States of ECLAC, together with several North American and European nations that have historical, economic and cultural ties with the region.
Visit the GLOSS*arama
|
|


|

|
                           AVERAGE PROPENSITY TO SAVE: The proportion of household income that is used for saving. The average propensity to save (abbreviated APS) is really nothing more than average saving. Together with the average propensity to consume, it indicates how a given level of income is divided between consumption and saving. A related saving measure is the marginal propensity to save. The average propensity to save (APS) indicates what the household sector does with income. The APS indicates the portion of income that is used for saving. If, for example, the APS is 0.1, then 10 percent of income goes for saving.The standard formula for calculating average propensity to save (APS) is: | Saving Schedule | 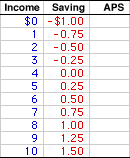
|
A saving schedule, such as the one presented to the right, provides data that can be used to run through a few APS calculations. The first column in this schedule presents household income, ranging from $0 to $10 trillion. The second column presents saving, ranging from -$1 to $1.5 trillion. The task at hand is to derive the average propensity to save at each income level.The average propensity to save is calculated by dividing saving in the second column by income in the first column. Beginning near the top of the schedule, if household income is $1 trillion, then saving is -$0.75 trillion, giving an average saving of -0.75. Running the numbers through the APS formula gives: | APS | = | saving
income | = | -$0.75
$1 | = | -0.75 |
Similar calculations can be performed for each income level. For example, if income from $4, then saving is also $0 trillion and the APS is equal 0 ($0/$4). If income is $8 trillion, the saving is $1 trillion and the APS is equal to 0.13 ($1/$8). To display all average propensity to save values, click the [APS] button.The prime conclusion from a quick look at the numbers is that APS increases as income increases. The APS is -0.75 for $1 trillion of income, then increases to 0.15 for $10 trillion of income. In other words, APS is not constant. The APS increases due to autonomous saving and induced saving. Autonomous saving is the -$1 trillion of saving that takes place if income is zero. Induced saving is the increase in saving that occurs due to an increase in income. Because saving is negative when income is zero, saving is necessarily less than income at low income levels, meaning the APS is less than one. Moreover, while saving is induced as income increases. The increase in saving increases the APS from its initial negative value into the positive range. The average propensity to save is one of four related measures. The other three are average propensity to consume, marginal propensity to save, and marginal propensity to consume. - Average Propensity to Consume: This is the proportion of household income that is used for consumption. Abbreviated APC, this is really nothing more than average consumption. Together with the average propensity to save, it indicates how a given level of income is divided between consumption and saving.
- Marginal Propensity to Save: This is the change in saving resulting from a change in income. Abbreviated MPS, this indicates the proportion of additional household income that is used for saving. It is the flip side of the marginal propensity to consume, and thus also quantifies the fundamental psychological law. The MPS is the slope of the saving line, which enters into the injections-leakages model. The multiplier is also related to the MPS.
- Marginal Propensity to Consume: This is the change in saving resulting from a change in income. Abbreviated MPC, this indicates the proportion of additional household income that is used for saving. It quantifies the fundamental psychological law and is the most important of these four measures. The MPC is the slope of the saving line, key to the slope of the aggregate expenditures line, and affects the magnitude of the multiplier.
Recommended Citation:AVERAGE PROPENSITY TO SAVE, AmosWEB Encyclonomic WEB*pedia, http://www.AmosWEB.com, AmosWEB LLC, 2000-2025. [Accessed: July 18, 2025].
Check Out These Related Terms... | | | | | | | |
Or For A Little Background... | | | | | | | | | | | | | |
And For Further Study... | | | | | | | | | | | | | | | | | | |
Search Again?
Back to the WEB*pedia
|

|

|
BROWN PRAGMATOX
[What's This?]
Today, you are likely to spend a great deal of time browsing through a long list of dot com websites seeking to buy either a case of blank recordable DVDs or a pair of red goulashes with shiny buckles. Be on the lookout for mail order catalogs with hidden messages.
Your Complete Scope
This isn't me! What am I?
|

|
|
Al Capone's business card said he was a used furniture dealer.
|

|
|
"A winner is someone who recognizes his God-given talents, works his tail off to develop them into skills, and uses those skills to accomplish his goals. " -- Larry Bird, basketball player
|

|
SAS
Statistical Analysis Software
|

|
|
Tell us what you think about AmosWEB. Like what you see? Have suggestions for improvements? Let us know. Click the User Feedback link.
User Feedback
|

|

