|
|
KEYNESIAN CROSS: The standard diagram used in Keynesian economics to identify the equilibrium level of aggregate output (that is, gross domestic product), with aggregate expenditures measured on the vertical axis, and aggregate output measured on the horizontal axis. This diagram contains two key lines, the aggregate expenditure line and the 45-degree line. Intersection between these lines indicates equilibrium aggregate output. This intersection, or cross, is what gives rise to the name.
Visit the GLOSS*arama
|
|


|

|
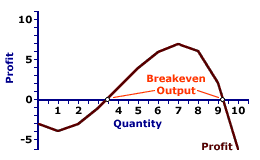
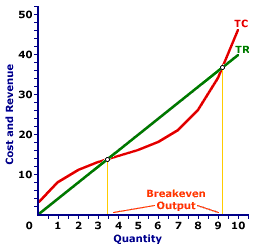
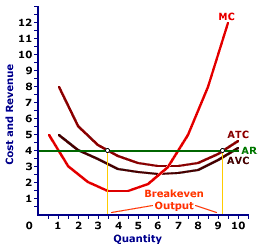
                           BREAKEVEN OUTPUT: The quantity of output in which the total revenue is equal to total cost such that a firm earns exactly a normal profit, but no economic profit. Breakeven output can be identified by the intersection of the total revenue and total cost curves, or by the intersection of the average total cost and average revenue curves. The most straightforward way of noting breakeven output, however, is with the profit curve. For a perfectly competitive firm breakeven output occurs where price is equal to average total cost. Breakeven Output
Profit Curve |  | Total Curves |  | Average Curves |  |
Breakeven output is a production level that achieves zero economic profit. In other words, a firm is just "breaking even." The total revenue received by a firm at the breakeven output just matches the total cost incurred. However, because total cost includes a normal profit, only economic profit is zero. A firm generally reports a positive accounting profit at the breakeven level of production.Breakeven output can be identified in one of three ways. This exhibit illustrates how breakeven output can be identified for a perfectly competitive firm, such as that operated by Phil the zucchini growing gardener. Phil sells zucchinis in a market with gadzillions of other zucchini growers and thus faces a going market price of $4 for each pound of zucchinis sold. Comparable to any firm, whether perfectly competitive or one with greater market control, Phil encounters a breakeven output level if total revenue is equal to total cost, average revenue is equal to average total cost, and profit is zero. In all three panels, Phil achieves breakeven output when producing about 3.5 pounds of zucchinis and when producing just over 9 pounds of zucchinis. The top panel presents the profit curve. The middle panel presents total revenue and total cost curves. The bottom panel presents average revenue and average total cost curves. - Profit: First, breakeven output can be illustrated with a direct evaluation of profit. If profit is zero, then breakeven output is achieved. In the top panel, the profit curve intersects the horizontal axis, meaning economic profit is zero, at these two output levels. At other output levels profit is either positive or negative.
- Total Revenue and Total Cost: Second, breakeven output can be identified by a comparison of total revenue and total cost. If the two are equal, then profit is zero and breakeven output is achieved. In the middle panel, the total revenue and total cost curves intersect at both production levels. At relatively low or relatively high output levels, the total cost curve is above the total revenue curve and economic profit is negative. At output levels in the middle of the chart, economic profit is positive as the total revenue curve lies above the total cost curve.
- Price and Average Cost: Third, breakeven output can be identified by a comparison of price (which is average revenue for a perfectly competitive firm) and average total cost. If per unit revenue is equal to per unit cost, then per unit profit is zero, overall profit is zero, and breakeven output is achieved. In the bottom panel, the average revenue and average total cost curves also intersect at both breakeven output levels. At relatively low or relatively high output levels, the average total cost curve is above the average revenue curve and economic profit is negative. At output levels in the middle of the graph, economic profit is positive as the average revenue curve lies above the average total cost curve.
While this discussion has been presented for a perfectly competitive firm, the story is essentially the same for firms operating in other market structures. The only difference is the shape and slope of the total revenue and average revenue curves. A monopoly, for example, faces a negatively-sloped demand curve. As such, the total revenue curve in the middle panel is a "hump-shaped" curve rather than a straight line and the average revenue curve in the bottom panel is negatively sloped.However, the breakeven points are identified in the same manner. They occur at the intersections of the total revenue and total cost curves and the intersections of the average revenue and average total cost curves.

Recommended Citation:BREAKEVEN OUTPUT, AmosWEB Encyclonomic WEB*pedia, http://www.AmosWEB.com, AmosWEB LLC, 2000-2025. [Accessed: June 30, 2025].
Check Out These Related Terms... | | | | |
Or For A Little Background... | | | | | | | | | | | | | | |
And For Further Study... | | | | | | | | |
Search Again?
Back to the WEB*pedia
|


|

|
|
One of the largest markets for gold in the United States is the manufacturing of class rings.
|

|
|
"I learned about the strength you can get from a close family life. I learned to keep going, even in bad times. I learned not to despair, even when my world was falling apart. I learned that there are no free lunches. And I learned the value of hard work. " -- Lee Iacocca
|

|
AIBD
Association of International Bond Dealers (now called International Securities Market Association)
|

|
|
Tell us what you think about AmosWEB. Like what you see? Have suggestions for improvements? Let us know. Click the User Feedback link.
User Feedback
|


|


