|
|
WELFARE ECONOMICS: A branch of economics that studies efficiency and the overall well-being of society based on alternative allocations of scarce resources. Welfare economics extends the microeconomic analysis of indifference curves to society as a whole. It is concerned with broad efficiency questions and criteria (Pareto efficiency and Kaldor-Hicks efficiency) as well as more specific efficiency issues (market failures, externalities, public goods).
Visit the GLOSS*arama
|
|


|

|
                           DECREASING-COST INDUSTRY: A perfectly competitive industry with a negatively-sloped long-run industry supply curve that results because expansion of the industry causes lower production cost and resource prices. A decreasing-cost industry occurs because the entry of new firms, prompted by an increase in demand, causes the long-run average cost curve of each firm to shift downward, which decreases the minimum efficient scale of production. The primary reason for a decreasing-cost industry is that an increase in demand triggers lower production cost and a downward shift of the long-run average cost curve as new firms entering the industry force down the prices of key resources. This could be because a key resource is able to take advantage of economies of scale or decreasing average cost in it is own production and supply. The entry of new firms into the cable television industry might, for example, enable lower cost of using communication satellites. The entry of new firms into the manufacturing industry in a given city might enable a lower cost of electricity.First DemandThe Decreasing-Cost
Zucchini Industry |  |
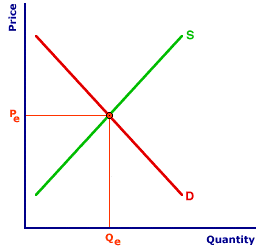
The perfectly competitive Shady Valley zucchini market can be used to illustrate a decreasing-cost industry. The original market equilibrium is presented in the exhibit to the right, with the supply curve S and the demand curve D. The market equilibrium price is Pe and the equilibrium quantity is Qe.The first step in identifying the long-run industry supply curve for a decreasing-cost industry is with an increase in demand. Click the [Demand Shift] button to illustrate the shift of the demand curve to D'. Note that with the increase in demand, the market price of zucchinis increases to Pe' and the equilibrium quantity rises to Qe'. The higher price and larger quantity are achieved as each existing firm in the industry responds to the demand shock. The higher price that buyers are willing to pay induces existing firms to increase their quantities supplied as they move along their individual marginal cost curves. The market, as such, moves along the original market supply curve from one equilibrium point to a higher equilibrium point. However, the higher price leads to above-normal economic profit for existing firms. And with freedom of entry and exit, economic profit attracts kumquat, cucumber, and carrot producers into this zucchini industry. An increase in the number of firms in the zucchini industry then causes the market supply curve to shift. How far this curve shifts and where it intersects the new demand curve, D', determines that the zucchini market is a decreasing-cost industry. The Supply ResponseEconomic profit induces non-zucchini firms to enter the zucchini industry. People like Dan the kumquat man begin producing zucchinis. As these new firms enter the zucchini industry, the market supply curve shifts rightward. The shift of the supply curve to S' can be seen with a click of the [Supply Shift] button. This new supply curve intersects the new demand curve, D', at the equilibrium price of Po and the equilibrium quantity of Qo.The key for a decreasing-cost industry is how far the supply curve shifts. For a decreasing-cost industry the shift is relatively far. As new firms enter the industry, they force down the resource prices and enable lower production cost. Perhaps the price of zucchini seeds falls. Maybe the price of zucchini fertilizer or zucchini shovels is lower. Whatever the actual resource price, the end result is that the long-run average cost curve shifts downward. The minimum efficient scale for a given perfectly competitive firm is now at a lower cost. This means that they can produce the extra quantity demanded by the zucchini buyers at a lower per unit cost than had prevailed. The main point of interest is that the new equilibrium price is lower than the original. To display the resulting long-run supply curve for this decreasing cost industry click the [Long-Run Supply Curve] button. The negative slope of the this long-run industry supply curve (LRS) indicates a decreasing-cost industry.

Recommended Citation:DECREASING-COST INDUSTRY, AmosWEB Encyclonomic WEB*pedia, http://www.AmosWEB.com, AmosWEB LLC, 2000-2025. [Accessed: July 18, 2025].
Check Out These Related Terms... | | | |
Or For A Little Background... | | | | | | | | | | | |
And For Further Study... | | | | | |
Search Again?
Back to the WEB*pedia
|


|

|
PINK FADFLY
[What's This?]
Today, you are likely to spend a great deal of time calling an endless list of 800 numbers wanting to buy either a weathervane with a cow on top or a box of multi-colored, plastic paper clips. Be on the lookout for high interest rates.
Your Complete Scope
This isn't me! What am I?
|

|
|
On a typical day, the United States Mint produces over $1 million worth of dimes.
|

|
|
"A winner is someone who recognizes his God-given talents, works his tail off to develop them into skills, and uses those skills to accomplish his goals. " -- Larry Bird, basketball player
|

|
CAP
Common Agricultural Policy
|

|
|
Tell us what you think about AmosWEB. Like what you see? Have suggestions for improvements? Let us know. Click the User Feedback link.
User Feedback
|


|


