|
|
COMMUNISM: In theory, an economy based on -- (1) a classless society, where everyone does their best to contribute to the common good, (2) a common, rather than individual, ownership of all resources, (3) the complete disappearance of government, and (4) income allocated based entirely on need rather than on resource ownership or contribution to production (that is, a needs standard, compare contributive standard).
Visit the GLOSS*arama
|
|


|

|
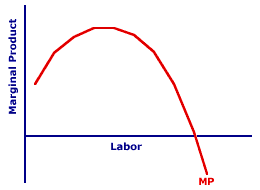
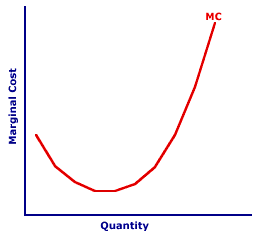
                           MARGINAL COST AND MARGINAL PRODUCT: The U-shape of the marginal cost curve is closely related to the hump-shape of the marginal product curve. The increasing portion of the marginal product curve corresponds with the decreasing portion of the marginal cost curve. The decreasing portion of the marginal product curve corresponds with the increasing portion of the marginal cost curve. The peak of the marginal product curve corresponds with the minimum of the marginal cost curve. Because variable cost is largely associated with the cost of employing a variable input in the short run, it is possible to identify a connection between the marginal cost curve and the marginal product curve.- The quantity of output in which marginal cost is at a minimum is the same quantity of output produced by the variable input when the marginal product of the variable input is at a maximum.
- Over the range of production in which marginal product increases and the variable input experiences increasing marginal returns, the marginal cost curve declines.
- Over the range of production in which marginal product increases and the variable input experiences decreasing marginal returns brought on by the law of diminishing marginal returns, the marginal cost curve is rising.
The correspondence between the marginal product and marginal cost curves indicates that the law of diminishing marginal returns is the key reason for increasing marginal cost. This further implies that the law of supply and the positively-sloped supply curve can be explained in the short run by increasing marginal cost.| Marginal Cost and Marginal Product |  |  |
This diagram displays the marginal product and marginal cost for the production of Wacky Willy Stuffed Amigos (those cute and cuddly armadillos, tarantulas, scorpions, and rattlesnakes). The top panel presents the marginal product of the variable input used to produced Stuffed Amigos. The bottom panel contains the marginal cost of producing Stuffed Amigos.- The marginal product curve in the upper panel has a distinctive hump-shape, with marginal product rising, reaching a peak, then falling. The rising portion of the marginal product curve is the result of increasing marginal returns. The falling portion is attributable to decreasing marginal returns, and in particular, the law of diminishing marginal returns.
- The marginal cost curve in the lower panel has a distinctive U-shape, with marginal cost falling, reaching a minimum, then rising. The falling portion of the marginal product curve is the result of increasing marginal returns. The rising portion is attributable to decreasing marginal returns, and in particular, the law of diminishing marginal returns.
The marginal cost curve can be thought of as something of a "reflection" of the marginal product curve. This reflection is not a perfect image, but it captures the essence of the shape.How does this work? Stage I: Increasing Marginal ReturnsIn production Stage I, with increasing marginal returns, marginal cost declines. Because each additional worker is increasingly more productive, a given quantity of output can be produced with fewer variable inputs. Consider an extreme example.- Suppose that the first worker employed by The Wacky Willy Company has a marginal product of one Stuffed Amigo and is paid $5 an hour. In this case, the marginal cost of producing the first Stuffed Amigo is $5. One worker, working one hour, produces one Stuffed Amigo, and the cost is $5.
- Now suppose, with increasing marginal returns, that the second worker has a marginal product of 2 Stuffed Amigos, but is paid $5 per hour like the first worker. In this case, the marginal cost of producing the second Stuffed Amigo is only $2.50. With a greater marginal product, the second worker needs to work only half-an-hour to produce one Stuffed Amigo, at a marginal cost of $2.50. One worker, working half-an-hour, produces one Stuffed Amigo, and the cost is $2.50.
The bottom line: With an increasing marginal product, marginal cost decreases.Stage II: Decreasing Marginal ReturnsIn production Stage II, with decreasing marginal returns, marginal cost increases. Because each additional worker is less productive, a given quantity of output needs more variable inputs. Consider what happens as The Wacky Willy Company produces enough to succumb to the law of diminishing marginal returns.- Suppose that the 101st worker employed by The Wacky Willy Company has a marginal product of 10 Stuffed Amigos and again is paid $5 an hour. In this case, the marginal cost of producing the one Stuffed Amigo is $0.50. One worker, working one-tenth of an hour, produces one Stuffed Amigo, and the cost is $0.50.
- Now suppose, with decreasing marginal returns, that the 102nd worker has a marginal product of 5 Stuffed Amigos, but is also paid $5 per hour like the other workers. In this case, the marginal cost of producing the one Stuffed Amigo is only $1. With a declining marginal product, the 102nd worker needs to work one-fifth of an hour to produce one Stuffed Amigo, at a marginal cost of $1.
The bottom line in this case: With a decreasing marginal product, marginal cost increases. The prime conclusion is that the positively-sloped portion of the marginal cost curve is directly attributable to the law of diminishing marginal returns.

Recommended Citation:MARGINAL COST AND MARGINAL PRODUCT, AmosWEB Encyclonomic WEB*pedia, http://www.AmosWEB.com, AmosWEB LLC, 2000-2025. [Accessed: July 18, 2025].
Check Out These Related Terms... | | | | | |
Or For A Little Background... | | | | | | | | |
And For Further Study... | | | | | | | | | | | | | |
Search Again?
Back to the WEB*pedia
|


|

|
ORANGE REBELOON
[What's This?]
Today, you are likely to spend a great deal of time wandering around the downtown area trying to buy either shoe laces for your snow boots or a rim for your spare tire. Be on the lookout for the happiest person in the room.
Your Complete Scope
This isn't me! What am I?
|

|
|
During the American Revolution, the price of corn rose 10,000 percent, the price of wheat 14,000 percent, the price of flour 15,000 percent, and the price of beef 33,000 percent.
|

|
|
"A winner is someone who recognizes his God-given talents, works his tail off to develop them into skills, and uses those skills to accomplish his goals. " -- Larry Bird, basketball player
|

|
PWAC
Present Worth of Annual Costs
|

|
|
Tell us what you think about AmosWEB. Like what you see? Have suggestions for improvements? Let us know. Click the User Feedback link.
User Feedback
|


|


